This post was originally published on this site
https://images.mktw.net/im-77301416
“The next major resistance area is the all-time high, just above 4800.”
The stock market, as measured by the S&P 500 Index
SPX
is blasting higher after the FOMC meeting this week seemed to convey a dovish attitude towards interest rates. SPX is well above its old 2023 highs set back in July, at 4600. SPX has now exceeded the next resistance area, at 4640, which was the high of March 2022. That means that the next major resistance area is the all-time high, just above 4800, set in January 2022. That is now within reach.
The market is stretched and overbought. There are gaps all over the SPX chart, all the way down to 4100, but it looks like it’s going to be a long time before those gaps are filled, if ever. The latest run has pushed SPX well above the +4σ “modified Bollinger Band” (mBB). That stops out the “classic” mBB sell signal that was generated in early December.
We do not trade those classic signals. Instead we wait for further confirmation in the form of a McMillan Volatility Band (MVB) sell signal. That never came, which sometimes happens and is the reason why we use MVB instead of classic signals. In any case, SPX now has to set up the entire process all over again in order to generate the next sell signal. That is probably going to take some time.

Equity-only put-call ratios continue to decline, and that is bullish for stocks. These put-call ratio buy signals will remain in effect until the ratios bottom out and begin to rise. There was heavy arbitrage on the CBOE again on December 13, which distorts the ratios. In the ratios we calculated, we throw out the arbitrage activity, if it can be identified, to attempt to get a “purer” picture of speculative activity.


Market breadth has not been great, in general, over the past week, but it has really begun to expand over the past couple of days. December 13 was a “90% up day” in terms of “stocks only” data but not in terms of NYSE data. Even so, the breadth oscillators are solidly on buy signals and are in very overbought territory. It is likely going to take two or three days of negative breadth before any sell signals would be generated here.
New Highs on the NYSE are expanding, and so the buy signal from this indicator remains in place. When this buy signal occurred just a little over a week ago, it seemed like it might too late to buy, but as we pointed out at the time, this indicator has a history of arriving late to the party, but when it does, the party goes on for a while.
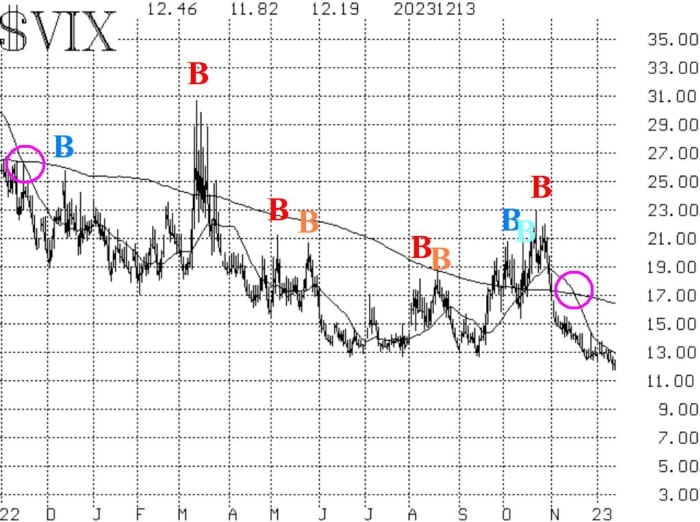
VIX has continued to hover at low levels, and so the trend of VIX buy signal remains in place. See the Market Insight section for more information on this low-priced VIX. That buy signal occurred in mid-November (circled area on the accompanying VIX chart). The fact that VIX is trading at low levels is merely another overbought indicator, but it is not a sell signal. Sell signals won’t arise until VIX begins to rise: specifically, if it returns to “spiking” mode.
The construct of volatility derivatives remains bullish in its outlook for stocks. The term structures slope uniformly upward, and the VIX futures are trading at large premiums to VIX. There was some “worry” expressed by a slightly elevated CBOE 9-day Volatility Index (VIX9D) earlier this week, but with the release of the CPI data and the conclusion of the FOMC meeting, it is back to “normal.”
In summary, we continue to maintain a bullish “core” position, and we will trade other confirmed signals around that. As the market continues to advance strongly, be sure to roll your call strikes higher or to take some partial profits. We want to retain upside exposure, but we don’t want to give back all the gains if trouble arises.
Market insight: Is VIX too low?
In the financial media, several articles of late are warning investors to be cautious because VIX
VX00,
VIX
is “too low.” These articles make great fodder for the press, but in general lack practical trading sense. Just because VIX is low doesn’t mean that the stock market is immediately going to collapse. It may be a precursor to some broad market selling further down the road, but a low VIX is not a problem until VIX rises out of its “low” state.
We did some research, looking for periods of time when VIX dropped below 14 and stayed there. The longest such time was 196 calendar days, beginning in August 2006 and ending in February 2007. SPX rose from 1280 to 1460 during that period, so shorting or standing aside because of a perceived “low VIX” would have been detrimental to your financial health. Eventually, VIX went into “spiking” mode (an increase of at least 3.0 points over any three-day or shorter time period, using closing prices), and the stock market fell sharply, but only briefly.
Similar occurrences were 162 calendar days below 14, ending in January 2018 (right before what they now call “volmageddon”) and 109 calendar days, ending in May 2006.
Currently VIX closed below 14 on November 17th and has remained there for 17 calendar days. Looking at past occurrences of 17 calendar days with VIX closing below 14, we find that the average length of time eventually stretched out to 37 calendar days (throwing out the 3 longest and the 3 shortest). The median time was 26 calendar days.
But sometimes, VIX rises up above 14 and drops right back down again, without much damage to the stock market. For example, between January 2005 and the afore-mentioned May 2006, VIX was below 14 for 477 out of 554 calendar days, or 86% of the time. There were a couple of excursions to the 17 area for VIX during that time period, and SPX fell by 5% to 8% on those occasions, but there was not even a 10% correction in the broad market.
The bottom line is that VIX can get low and stay low for a long time. Expecting a market crash, or even a severe selloff, to occur because of the “low” VIX is not likely. Rather, the market can continue upward all the while (“Markets can remain irrational for longer than you can remain solvent,” said John Maynard Keynes). So, one must wait for VIX to begin to rise before bearish positions can be taken.
New recommendation: Unum (UNM)
The weighted put-call ratio for UNM
UNM,
has generated a buy signal, and the stock has confirmed it by breaking out over resistance.
Buy 4 UNM Mar (15th) 45 calls at a price of 2.00 or less.
UNM: 44.35 Mar (15th) 45 call: 1.90 bid, offered at 2.10
We will hold this position as long as the weighted put-call ratio of UNM remains on a buy signal.

New recommendation: Griffon (GFF)
We don’t often recommend a straddle buy (the simultaneous purchase of both a put and call with the same terms) in this newsletter, but this one seems quite attractive. GFF
GFF,
has been on a tear, rising to $54 a share from $39 in just over a month. Meanwhile, its options have become relatively cheap. That is the main criterion for owning a straddle, but one also wants to make sure that the underlying stock can move far enough during the life of the straddle to produce a profit. That movement is certainly possible with GFF. Either the stock keeps up the bullish path that was launched back in late October, or it gives back the recent gains with a sharp decline. Either should work in this case. We are going to buy two straddles.
Buy 2 GFF Apr (19th) 50 calls and Buy 2 GFF Apr (19th) 50 puts for a combine debit of 9.00 per straddle or less
Roll the calls up to the Apr (19th) 60 calls if GFF trades at 60; roll the puts down to the Apr (19th) 40 calls if GFF trades at 40. Stop out if the straddle closes at a price of 4.50 or less on any day.

Follow-up action
All stops are mental closing stops unless otherwise noted.
We are using a “standard” rolling procedure for our SPY spreads: in any vertical bull or bear spread, if the underlying hits the short strike, then roll the entire spread. That would be roll up in the case of a call bull spread or roll down in the case of a bear put spread. Stay in the same expiration and keep the distance between the strikes the same unless otherwise instructed.
Long 3 expiring XLE Dec (15th) 85 puts: The weighted put-call ratio of XLE
XLE
has rolled over to a buy signal, so sell these puts and do not replace them.
Long 1 SPY Dec (29th) 464 call: A spread was bought in line with the CBOE equity-only put-call ratio buy signal. It has been rolled up several times, with December 12 being the most recent. Roll the SPY
SPY
call up if it becomes at least 8 points in-the-money. We are holding without a stop for now.
Long 3 expiring ES Dec (15th) 60 calls: We will hold this position as long as the weighted put-call ratio chart for ES
ES,
remains on a buy signal. ES is between strikes right now, so do the following: 1) sell all three of the expiring calls, and buy two (only two) ES Jan (19th) 60 calls. This will take a partial profit without risk all of the remaining value in the calls.
Long 4 XLP Dec (29th) 70 calls: Raise the stop for XLP
XLP
to 70.00.
Long 1 SPY Dec (29th) 465 call: This position was initially a long straddle. It was rolled up, and the puts were sold. The calls were rolled up again on December 13. Continue to roll the call up if it becomes 8 points ITM, and that has become necessary on December 14. This is, in essence, our “core” bullish position.
Long 5 expiring AVPT Dec (15th) 7 calls: Roll to the Jan (19th) 8 calls. The trailing closing stop for AVPT
AVPT,
remains at 7.75.
Long 2 TECH Jan (19th) 70 calls: We will hold as long as weighted put-call ratio is on a buy signal. The calls were rolled up when TECH
TECH,
traded at 70 on December 12.
Long 4 KHC Jan (19th) 37.5 calls: We will hold as long as weighted put-call ratio is on a buy signal. The calls were rolled up when KHC
KHC,
traded at 37.5 on December 13.
Long 2 IWM Jan (19th) 190 calls: This is our post-Thanksgiving seasonal position. We will hold without a stop, since this is a rather long seasonal period extending through the first two trading days of 2024. We rolled the call up twice, most recently on December 13. Roll up again if the call becomes six points in-the-money (i.e., at 196), and that has become necessary this morning of December 14.
All stops are mental closing stops unless otherwise noted.
Send questions to: lmcmillan@optionstrategist.com.
Lawrence G. McMillan is president of McMillan Analysis, a registered investment and commodity trading advisor. McMillan may hold positions in securities recommended in this report, both personally and in client accounts. He is an experienced trader and money manager and is the author of the best-selling book, Options as a Strategic Investment. www.optionstrategist.com
©McMillan Analysis Corporation is registered with the SEC as an investment advisor and with the CFTC as a commodity trading advisor. The information in this newsletter has been carefully compiled from sources believed to be reliable, but accuracy and completeness are not guaranteed. The officers or directors of McMillan Analysis Corporation, or accounts managed by such persons may have positions in the securities recommended in the advisory.
