This post was originally published on this site
The Center for Retirement Research first released its National Retirement Risk Index (NRRI) in 2006. The goal was to summarize in a single number the extent to which today’s workers would be prepared for retirement.
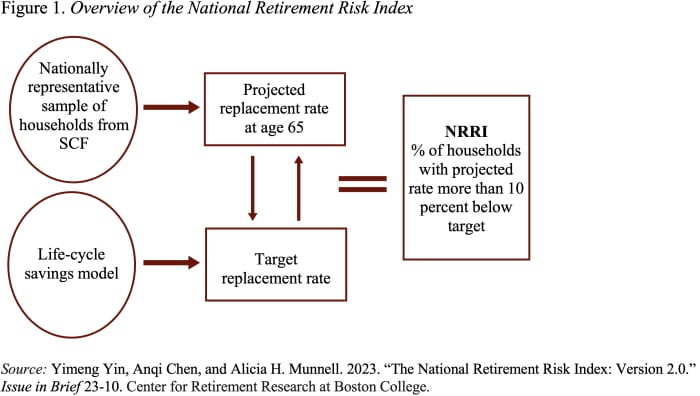
The Index uses the Federal Reserve’s triennial undefined to compare projected replacement rates — retirement income as a percentage of preretirement income — with target rates that would allow households to maintain their living standard. Those households with a projected replacement rate that is more than 10% below the target are characterized as falling short (see Figure 1).

After nearly two decades of updating data and modifying the program, the index was sorely in need of clean up. Candidly, its innards were a mess. My colleague Yimeng Yin worked on the project solidly for nine months. In addition to updating data and moving the codebase from Stata and Excel spreadsheets to Python, we decided on four major improvements:
- Shifting the basis for projecting wealth-to-income from means to medians, which makes the wealth projections at retirement better reflect the observed distributions.
- Projecting financial assets and nonmortgage debt separately, allowing for more in-depth analysis as well as counterfactual analysis focusing on borrowing.
- Using much richer household characteristics for calculating target replacement rates.
- Incorporating the earned-income tax credit in replacement rate calculations to better capture the income these households will need to replace in retirement.
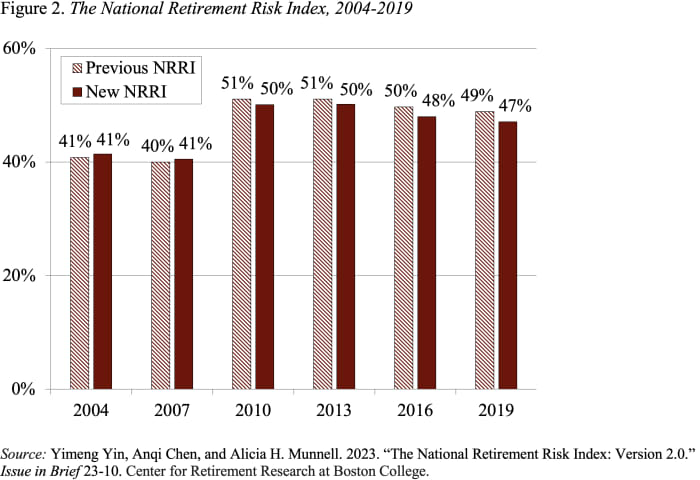
Despite the extensive changes in data and methodology, the overall level and time pattern of the Index remain the same as before (see Figure 2). Thus, the most important finding still holds: about half of working-age households will not be able to maintain their preretirement living standard.

Moreover, the pattern continues to reflect the health of the economy. The Index increased substantially from 2007 to 2010 during the Great Recession, and then declined a bit from 2013 to 2019 as the economy enjoyed low unemployment, rising wages, strong stock market growth, and rising housing prices. These improvements were modest due to some countervailing longer-term trends — such as the gradual rise in Social Security’s Full Retirement Age (FRA) and the continued decline of interest rates — which made it more difficult for households to achieve retirement readiness.
When viewed by wealth, households’ retirement preparedness shows a sensible pattern, with a large difference between the top and bottom wealth groups (see Table 1).

The bottom line is that — no matter how much the methodology is modified and the data updated — the NRRI continues to show a large share of today’s working-age households will not be able to maintain their preretirement standard of living once they retire.
This is not a time to even contemplate cutting back on Social Security benefits. And it is the time to push for universal coverage by retirement savings plans so that every household has some ability to save some additional money.

