This post was originally published on this site
https://images.mktw.net/im-43189448Early futures trading suggests Wall Street will start the week on a cautious note with the S&P 500 consolidating after closing the previous session at yet another record, powered by big tech.
Can this dynamic continue? For David Kostin, chief U.S. equity strategist at Goldman Sachs, the answer depends primarily on the ability of the Magnificent 7 — Alphabet
GOOG,
Amazon.com
AMZN,
Apple
AAPL,
Meta Platforms
META,
Microsoft
MSFT,
Nvidia
NVDA,
and Tesla
TSLA,
— to deliver rapid revenue growth in 2024.
“While elevated hedge fund positioning, numerous antitrust lawsuits from the DoJ and the FTC, and shifts in the macro regime will influence returns for the stocks, we believe that sales growth for the seven stocks will be the most important driver of the group,” says Kostin and team in a note published late Friday.
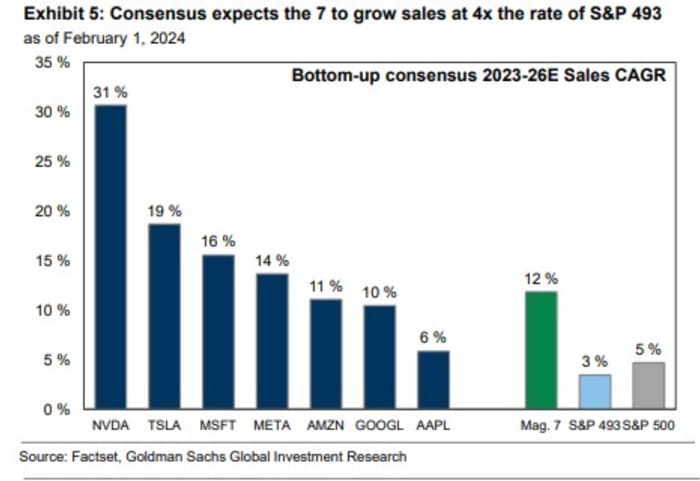
Crucially, analysts’ consensus estimates are that the Mag 7 will “collectively grow sales at a 12% CAGR through 2026 compared with an 3% CAGR for the remaining 493 companies in the S&P 500 index,” says Kostin. CAGR stands for compound annual growth rate.
An expected expansion of margins by 256 basis points during the next three years –compared with 44 basis points for the rest of the market — will help turn those higher sales into even greater profits.
An important caveat; the Mag 7 is not homogenous. For example, Nvidia is expected to grow sales during the next three years at a 31%
annual pace compared with just 6% for Apple. Recent consensus sales forecasts for Tesla have been cut.
Source: Goldman Sachs
But what about the apparently rich valuations that big tech currently commands? Kostin argues that though the Mag 7 stocks in aggregate currently trade at a forward price/earnings multiple of 30 compared with 18 for the remaining 493 S&P 500 companies, some context is required.
“While elevated vs. the last 10 years, this 63% P/E premium ranks well below the peak 103% premium reached in 2021,” Kostin says. “The Magnificent 7 also carry significantly lower valuations than their peers at the height of the Tech Bubble in March 2000,” when the five largest stocks traded at a 73% premium to the S&P 500’s multiple of 25 times.
And importantly, Goldman says that contrary to some fears big tech’s surge is all about valuation multiples, improved earnings are really the driver for Mag 7 stocks.
Since the end of 2019, the Mag 7 collectively delivered a 28% annualized return, according to Kostin. About 27 percentage points of that is attributable to earnings growth, consisting of 21 pp sales growth and 6 pp margin expansion, with only 1 pp due to multiple expansion. In contrast, he says, earnings drove only 13 pp of the S&P 500’s 17% annualized return since 2019.
“Fast near-term and long-term growth, high net margins, and strong balance sheets support the group’s premium multiple,” says Goldman.

Source: Goldman Sachs
Another reason big tech is attractive is its new-found insensitivity to interest rates. “Historically, the group has benefited from falling yields due to the long duration of their cash flows,” says Kostin. “However, the group outperformed in the high bond yield environment of the last 24 months in large part because of their strong balance sheets and elevated margins.”
But, for all the positivity, the Goldman team finishes with a warning. Previous periods of tech exuberance have shown investors believe consensus estimates at their own risk.
“In March 2000, Microsoft, Cisco
CSCO,
General Electric
GE,
Intel
INTC,
and Exxon Mobil
XOM,
were the largest S&P 500 companies, comprising 18% of the index,” Kostin notes. Consensus forecasts showed the group growing sales at a 16% CAGR over the next two years. They actually delivered just 8%.
“The group went on to underperform the S&P 500 by 21 percentage points over the next 24 months.”
Markets

U.S. stock-index futures
ES00,
NQ00,
are a bit lower as benchmark Treasury yields
BX:TMUBMUSD10Y
rise. The dollar
DXY
is higher, while oil prices
CL.1,
slip and gold
GC00,
trades around $2,020 an ounce.
| Key asset performance | Last | 5d | 1m | YTD | 1y |
| S&P 500 | 4,958.61 | 0.62% | 4.10% | 3.96% | 20.62% |
| Nasdaq Composite | 15,628.95 | 1.12% | 7.61% | 4.11% | 30.17% |
| 10 year Treasury | 4.086 | 0.70 | 5.43 | 20.48 | 44.11 |
| Gold | 2,041.00 | 0.41% | 0.34% | -1.49% | 8.55% |
| Oil | 71.9 | -6.60% | 1.38% | 0.80% | -3.43% |
| Data: MarketWatch. Treasury yields change expressed in basis points | |||||
For more market updates plus actionable trade ideas for stocks, options and crypto, subscribe to MarketDiem by Investor’s Business Daily.
The buzz
U.S. economic data released on Monday includes the January S&P final services PMI, due at 9:45 a.m. Eastern, and the January ISM services report at 10 a.m.
Companies reporting results on Monday include Caterpillar
CAT,
McDonald’s
MCD,
and IDEXX Laboratories
IDXX,
before the opening bell rings on Wall Street, followed after the close by Palantir Technologies
PLTR,
Vertex Pharmaceuticals
VRTX,
and NXP Semiconductors
NXPI,
Federal Reserve Chair Jerome Powell said over the weekend that the central bank expects to make three 25 basis point rate cuts in 2024, roughly half what the market expects.
Donald Trump said that if he becomes U.S. President he would consider imposing tariffs on China’s goods that may exceed 60%.
Best of the web
The money and drugs that tie Elon Musk to some Tesla directors.
The great U.S. — Europe antitrust divide.
Why NYC apartment buildings are on sale now for 50% off.
The chart
This is a somewhat disturbing chart for those wedded to fiscal prudence. It’s from Torsten Slok, chief economist at Apollo Global, and he notes that: “In 2021, U.S. government interest payments were around $350 billion, see chart below. Because of the increase in interest rates and debt levels, annualized debt servicing costs are now above $700 billion.”

Source: Apollo Global
Top tickers
Here were the most active stock-market tickers on MarketWatch as of 6 a.m. Eastern.
| Ticker | Security name |
|
TSLA, |
Tesla |
|
NVDA, |
Nvidia |
|
META, |
Meta Platforms |
|
AMZN, |
Amazon.com |
|
AAPL, |
Apple |
|
PLTR, |
Palantir Technologies |
|
AMD, |
Advanced Micro Devices |
|
NIO, |
NIO ADR |
|
MSFT, |
Microsoft |
|
PHUN, |
Phunware |
Random reads
Man buys house on Amazon for £20,500.
Finance worker pays out $25 million after video call with ‘deepfake CFO’.
World’s sexiest accent revealed.
Quelle surprise! Parisians vote for rise in SUV parking fees.
Need to Know starts early and is updated until the opening bell, but sign up here to get it delivered once to your email box. The emailed version will be sent out at about 7:30 a.m. Eastern.
Check out On Watch by MarketWatch, a weekly podcast about the financial news we’re all watching – and how that’s affecting the economy and your wallet. MarketWatch’s Jeremy Owens trains his eye on what’s driving markets and offers insights that will help you make more informed money decisions. Subscribe on Spotify and Apple.
