This post was originally published on this site
The S&P 500 on Monday extended a streak that should make investors look before they leap after any stock-market bounces, a top Wall Street technical analyst warned.
The S&P 500’s
SPX,
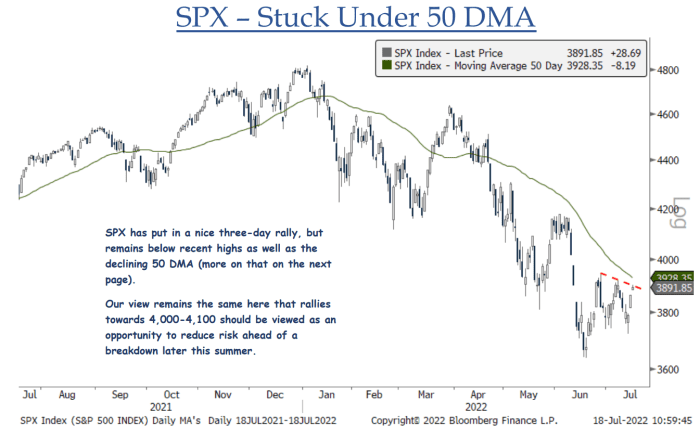
close below 3,928 marked the U.S. large-cap benchmark’s 60th consecutive day below its 50-day moving average, its longest such streak since 2008, said Jonathan Krinsky, analyst at BTIG in a Monday note (see chart below). The 50-day average is viewed as an indicator of an asset’s short-term trend.

BTIG
The S&P 500 fell 0.8% to close near 3,830 on Monday, after stocks gave up early gains. The Dow Jones Industrial Average
DJIA,
slumped 215 points, or 0.7%, after rising more than 350 points at its session high. The Nasdaq Composite
COMP,
dropped 0.8%.
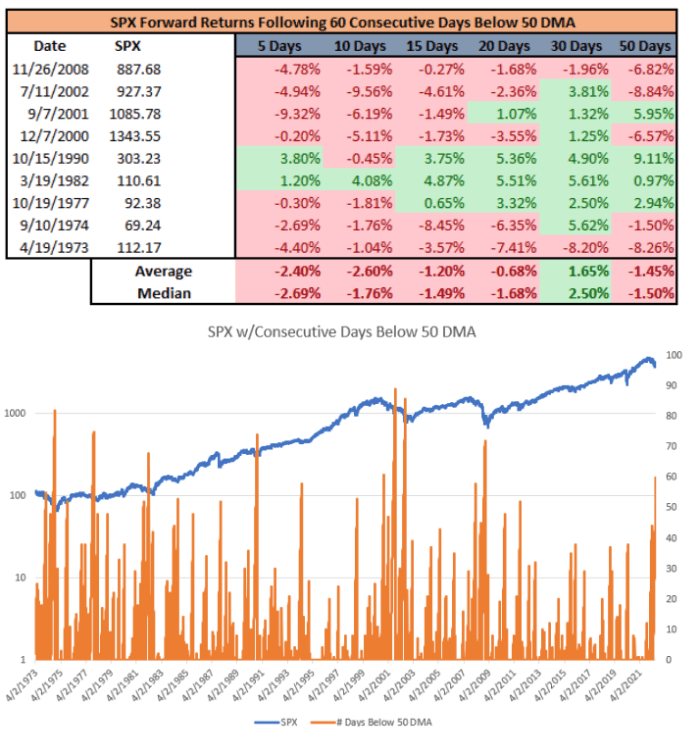
Krinsky said that in the last 50 years, “the majority of similar streaks have occurred in established bear markets, which means investors should be cautious even when the index pushes back above the average.”
In One Chart: This bear market in stocks remains historically shallow and short: Jefferies
Diving deeper into the historicals, the analyst observed that there have been nine other streaks of at least 60 days over the last half-century. Average and median returns tended to be rather negative over 5 to 20 days, he found, though most of the incidents saw positive returns 30 days out (see charts below).

BTIG
A retreat by the ICE U.S. Dollar Index
DXY,
which had hit a 20-year high last week, and a pullback in recent weeks by Treasury yields have allowed stocks and other so-called risk assets to gain some ground, but it’s “far too soon to say their trends have reversed,” Krinsky said, warning that a rise in dollar or yields could see equities come under renewed pressure.
“Our view remains the same here that rallies towards 4,000-4,100 should be viewed as an opportunity to reduce risk ahead of a breakdown later this summer,” he said.
Read: Why the analyst who called summer stock-market bounce now sees more S&P 500 upside

