This post was originally published on this site
U.S. stocks remain in bounce mode after the S&P 500 index tumbled last week to its lowest finish since December 2020, but many chart watchers remain unconvinced the uptick will prove to be anything more than another bear-market rebound.
What would it take to change their minds? The 3,800 level on the index, which has so far proven to be stiff resistance, is in focus.
“Since the beginning of last week, 3,800 has become a new ceiling for the S&P 500 as sellers have repeatedly stepped in and overwhelmed the tentative, weakhanded bids,” said Tom Essaye, founder of Sevens Report Research, in a Thursday note.
The S&P 500
SPX,
was up 0.1% at 3,763 in choppy trade Thursday afternoon, and on track for a 2.4% weekly gain. The Dow Jones Industrial Average
DJIA,
was down around 90 points, or 0.3%, on track for a 1.7% weekly advance.
The price action around 3,800 is in keeping with the large-cap benchmark’s bear-market slide this year, Essaye observed.
In early February, the S&P 500 repeatedly tested the 4,600 level before a 10% peak-to-trough drop to its late-February low, he recalled. Then after a March bounce, 4,500 served as a ceiling, with the market’s early April failure setting the stage for another 10% decline, Essaye said. In late April, 4,300 became the new resistance, with the market failing to overcome it several times before falling more than 11% into the latter half of May. In early June, 4,150 became resistance, with failure to overcome leading to a 13% peak-to-trough decline.
“Now, whether the market is poised to fall another 10% from this new resistance level (which would be down towards the 3,400 area) remains to be seen and a squeezy leg higher is still a very good possibility,” Essaye said. “But bottom line, markets have a habit of repeating themselves, and so far this year, the S&P 500 has failed at ’round numbers’ likely due to the impact of derivatives traders, a minimum of four times.”
That leaves 3,800 as critical near-term tipping point to watch, he said, as a break above could trigger a “potentially violent” squeeze higher, “while another failure would mean new lows are all but certain,” Essaye said.
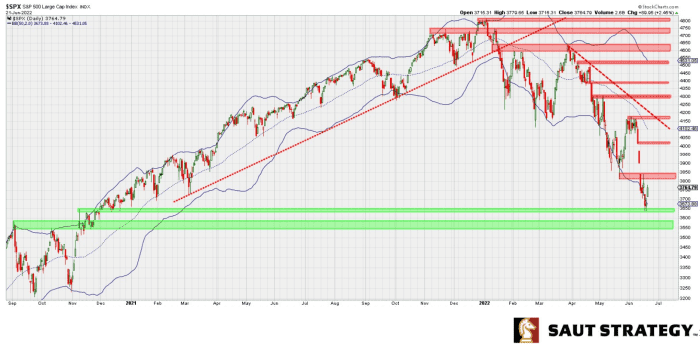
Technical analyst Andrew Adams, in a Wednesday note for Saut Strategy, described the market as taking “baby steps to try to find a bottom here,” but noted a close above the 3,800 level would provide some comfort.
Pointing to the chart below, Adams said there was technical justification for the S&P 500 bouncing where it did on Friday, providing at least some preliminary indications that a potential low was struck. Follow-through to the upside is necessary in the days ahead, he wrote, with the first hurdle at 3,800 and a test of the “gap” on the chart between 3,838 and 3,900.

Saut Strategy
The technician noted “open space” between 3,800 and roughly 4,100 on the chart thanks to the market’s rapid fall over the past few weeks, arguing that if the S&P 500 can sustain a move above 3,800 it’s possible that a “price vacuum” could pull the index higher. The environment, however, remains “high risk” below 3,800.
“I’ll feel a little better about taking chances on the long side if the S&P can break above 3800 and hold above it,” Adams wrote. “If that happens, I think the more aggressive participants can start adding back on some risk in hopes of a possible low being struck. Until then, we have to make this market prove itself.”

