This post was originally published on this site
Breaking the 200-day moving average is not the kiss of death for U.S. stocks, which might explain why the Dow Jones Industrial Average
DJIA,
on Jan. 24 recovered from a 1,000-point plunge and finished up for the day. It was just late last week when both the Dow and S&P 500
SPX,
breached their respective 200-day moving averages — considered by many stock-market technicians to indicate that the market’s major trend has turned down.
The historical record does not support this bearish interpretation. The U.S. stock market historically has not performed more poorly after dropping below the 200-day moving average than it does at any other time.
To show this, I analyzed the S&P 500 (or its predecessor index) back to the mid-1920s. I focused in particular on all days on which the index first dropped below its 200-day moving average. As you can see from the table below, the S&P 500’s average return in the wake of such days was slightly better than on all other days.
| Subsequent month | Subsequent quarter | Subsequent 6 months | Subsequent year | |
| 200-day moving average sell signals | 0.7% | 2.3% | 4.6% | 8.2% |
| All other days | 0.6% | 1.9% | 3.7% | 7.7% |
Moreover, none of the differences reported in this chart is significant at the 95% confidence level that statisticians often use when determining if a pattern is genuine.
The past 30 years
You might worry that the story told by this chart is skewed by experience many decades ago and is not as relevant to today’s market. In fact, the pattern shown in the table would be even more pronounced if I were to have focused only on the past two or three decades. This is not an accident, as I’ve discussed in previous columns. It’s exactly what you would expect given the advent of easily and inexpensively traded exchange-traded funds benchmarked to the S&P 500 (or other broad-market benchmarks).

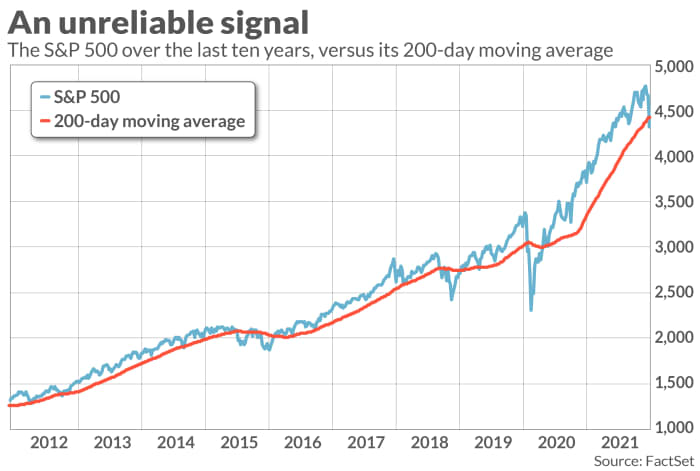
Take a look at the chart above, which plots the S&P 500 over the past decade along with its 200-day moving average. Notice that, more often than not over the past 10 years, whenever the S&P 500 dropped below its 200-day moving average it typically reversed course and rallied.
There’s no guarantee that the same will happen this time. Indeed, the stock market’s current prospects may be bleak. The point is that its prospects are no worse just because the 200-day moving average was breached.
Mark Hulbert is a regular contributor to MarketWatch. His Hulbert Ratings tracks investment newsletters that pay a flat fee to be audited. He can be reached at mark@hulbertratings.com

