This post was originally published on this site
The U.S. stock market will produce a modestly positive return over the next 12 months. You might not think that’s particularly newsworthy. But it is when, as currently is the case, some on Wall Street are claiming that insiders have never been more bearish than they are now. If true that would be alarming, since insiders have keener insight into their companies’ prospects than the rest of us.
But, fortunately, this is not true — at least not for the types of insiders who historically are worth following.
That’s the conclusion I draw from research conducted by Nejat Seyhun, a finance professor at the University of Michigan and one of academia’s leading experts on interpreting the behavior of corporate insiders.
There are three categories of insiders, and only two are important for investors to follow, according to Seyhun: corporate directors and officers. Right now, according to his latest data, insiders in these two categories on balance are fairly close to being in the middle of their historical range between being extremely bullish or extremely bearish.
Their current posture translates into an expected U.S. stock market return over the next 12 months that’s only moderately below the historical average.
The third category of insiders, the one that Seyhun’s research found to not be worth following, contains companies’ largest shareholders. Because their transactions are typically several orders of magnitude greater than those of officers and directors, the overall insider data will be dominated by this category of insiders who have the least insight. That’s why Seyhun ignores these largest shareholders when analyzing insider behavior.
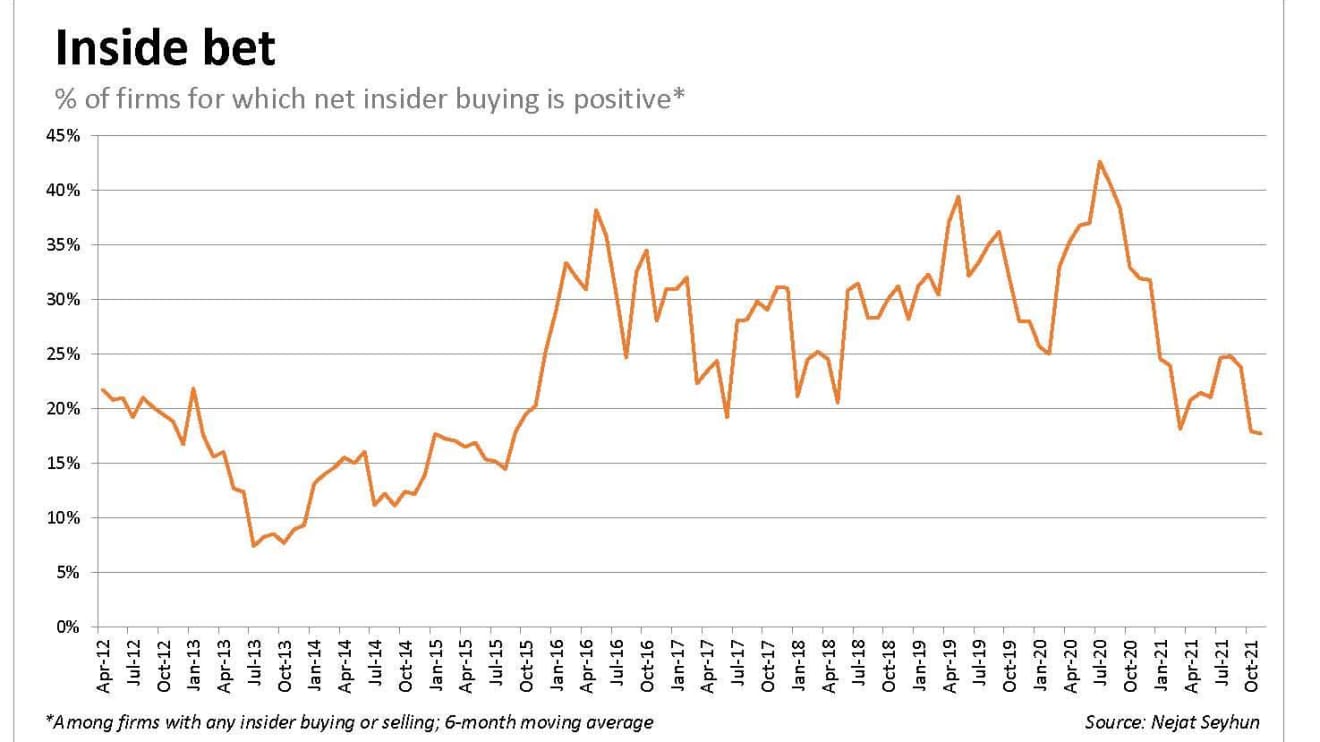
The chart below plots the insider statistic that Seyhun has found to have significant predictive power. It is the six-month moving average of the percentage of publicly traded companies for which there is net buying from officers and directors. Companies for which there is no insider buying or selling are ignored for purposes of calculating this statistic. Its latest value is 18%.

This may strike many of you as alarmingly low, so it’s important to focus on two different features of the chart. First, notice that the indicator was at much lower levels in 2013, and that year and subsequent years turned out to be very good for equities. Second, notice that this insider indicator over the past decade has never risen above 50%. In the wake of the February-March 2020 waterfall decline, for example, which was when the insiders on balance were close to being as bullish as they have ever been, the indicator rose to 43%. Its long-term average is in the low 20s, only slightly higher than the latest reading.
The reason the majority of companies experience net insider selling is that both corporate officers and directors receive a large chunk of their compensation in the form of their companies’ stock. Though the acquisition of those shares will never show up as purchases in the insider data, the eventual sale of those shares will. So it makes sense that the insider data will be skewed towards more sales than purchases.
Another reason not to be alarmed by what might otherwise appear to be excessive insider selling: Many insider sales are made for reasons having nothing to do with their opinions about their companies’ prospects. They may be needed to pay for a child’s college tuition or make a down payment on a house, for example.
It’s far different when an insider uses personal assets to buy more company stock. That’s why you should focus on the percentage of companies for which there is net insider buying. Currently, this percentage is slightly below its historical average.
Mark Hulbert is a regular contributor to MarketWatch. His Hulbert Ratings tracks investment newsletters that pay a flat fee to be audited. He can be reached at mark@hulbertratings.com
More: What a Fed led by Powell and Brainard means for Americans’ bank accounts

