This post was originally published on this site
Lumber prices have experienced one of their biggest and quickest plunges in history— with the spot futures contract dropping more than $670, or 40%, in just 25 trading sessions.
It’s human nature to try to find meaning in this, since the alternative is to accept that price changes this momentous are nothing more than merely random fluctuations. None of us like to accept that our investment portfolios could be subject to such cruel twists of fate.
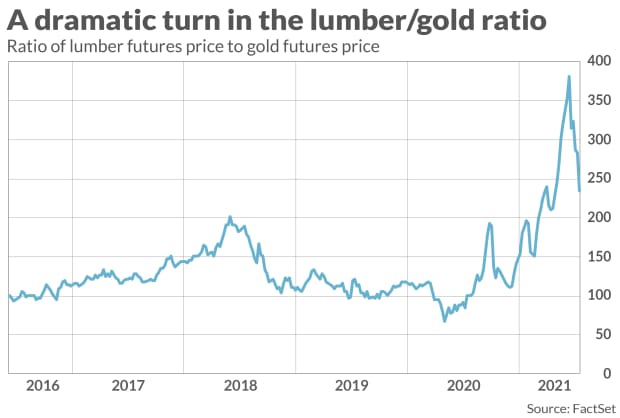
One way in which some are finding meaning in lumber’s decline is via a market-timing indicator based on the ratio of lumber
LB00,
to gold
GC00,
One study found that when the ratio is higher than where it was 13 weeks previously, conditions should be favorable for U.S. stocks. When it’s lower, U.S. Treasury bonds are preferred.
Not surprisingly, given lumber’s recent plunge, this ratio’s current message is bearish for stocks. (See chart below.) To help determine how much weight to place on that message, I tested the ratio back to 1984 — which is how far back data extend on FactSet. For each week since then, I calculated whether the ratio was higher or lower than where it was 13 weeks previously.

The table below reports the frequency of a rising market as a function of whether the lumber-gold ratio’s 13-week change was positive or negative. I used the Wilshire 5000’s Total Return Index as the market benchmark.

Notice that the lumber-gold ratio makes little to no difference to the frequency of a higher stock market. This suggests that the recent downturn in the lumber-gold ratio may not be as alarming as it otherwise might appear.
Of course, it’s possible that even though a decline isn’t more likely when the ratio’s 13-week change is negative, the declines that do take place are more severe. The table below reports the relevant data, which tell a similar story as the table above.

To be sure, this discussion is not an exhaustive analysis of the lumber-gold ratio’s potential value. There may be other ways of slicing and dicing the data that uncover ways in which it can be of use to investors. Nevertheless, the data would seem to suggest that the recent downturn in the lumber-gold ratio is not in and of itself a huge cause for alarm.
None of these results guarantees that the stock market won’t experience a correction in coming weeks, or even begin a bear market. It very much could, at any time, given how overvalued the stock market is. My point is that, as far as I can see, the declining lumber-gold ratio is not an additional reason for predicting such a downturn.
Gold-platinum ratio
In the meantime, you may want to give the stock market the benefit of the doubt. That’s because of another commodity-market-based ratio that a peer-reviewed academic study has found to have an excellent record forecasting the stock market’s 12-month return. This other ratio is the price of gold divided by the price of platinum.
I most recently wrote about this ratio in February. Though the ratio is a lot lower today than the multiyear high it set at the bottom of last March’s waterfall decline, it still is above its long-term average. Accordingly, though the stock market’s upside potential over the next 12 months is nowhere as strong as it was as year ago, it still is above average.
Mark Hulbert is a regular contributor to MarketWatch. His Hulbert Ratings tracks investment newsletters that pay a flat fee to be audited. He can be reached at mark@hulbertratings.com
More: Odds favor the Dow being higher at the end of 2021 and 125 years of history supports this
Plus: The S&P 500 now is top-heavy in 5 big tech stocks but that alone won’t end this bull market

