This post was originally published on this site
Google parent Alphabet Inc. is one of the most searched-for companies on MarketWatch. This quarterly review will show comparisons of key metrics to watch and the most important issues to help investors makes decisions about whether to own shares.
The update includes comparisons of results to competitors, or at least other Big Tech stocks that are similarly dominant even if they operate in different corners of the market.
Keep in mind that no two companies are alike — even rivals don’t compete in every space. Any investor needs to do their own research to make informed long-term decisions.
Where Alphabet fits in
As one of the “four horsemen” of big U.S. tech stocks valued at more than $1 trillion in market capitalization, Alphabet
GOOG,
GOOGL,
is among the largest companies in the world. That’s in part because it is so dominant in digital advertising. It remains the default search engine for many internet users and it is also the key infrastructure provider for the vast majority of online advertising as it stands between the marketers looking to reach new customers and the websites looking to maximize their revenue by putting ads in front of visitors.
Yes, Alphabet does lots of other things — from its Google Cloud web infrastructure efforts to its innovative R&D projects, such as Waymo self-driving cars — but it is still innovating and exploring new areas that could pop up in the future. But as you’ll see, all that doesn’t add up to much when put beside the tremendous online advertising business it operates.
Key metrics
Alphabet just wrapped up its fiscal first quarter and posted earnings at the end of April. As usual, the growth was significant as the dominance of its advertising platform continued without a hitch.
Sales growth
(Company filings)
(Company filings)
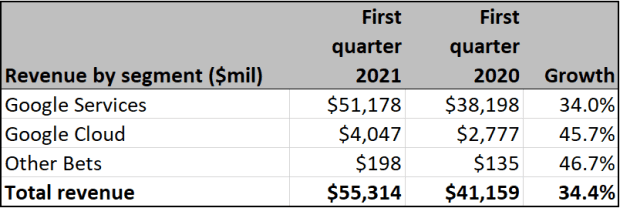
Alphabet reports its sales in three segments: Google Services, which includes YouTube video ads as well as its ad network sales and its search-related ads, then the lesser segments of Google Cloud and a catch-all that’s simply called “Other Bets.”
As you can see, sales comparison by category proves that the only thing GOOG investors really need to worry about right now is the advertising money it makes. And with an impressive 34% growth rate for the core business line, that’s not entirely a bad thing.
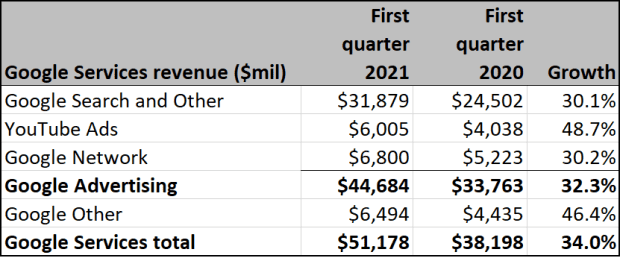
It’s worth noting that Alphabet has decided to give investors a deeper understanding of its broad Google operations by breaking them out into four discrete subsegments. Those include search-related advertising served to people who visit the eponymous search engine, YouTube video ads and the Google Network, which plugs the company’s technology into third-party websites to present ads (and take a small cut of the revenue). These all roll together to create a collective Google Advertising group.
On top of that, there’s also Google Other, which includes YouTube TV, the Google Play store and some hardware, such as Chromebooks.
Any one of those segments individually are bigger than both Cloud and Other Bets combined — so you can get a much better view of the stock by looking at these subcategories of work within Google.
Pricing power and profitability
It’s not apples-to-apples to compare Alphabet to some other big tech stocks like Amazon.com Inc.
AMZN,
which operates a massive e-commerce network, or Apple Inc.
AAPL,
which is mostly a hardware company. But as Peter Thiel famously once said, “competition is for losers” and the biggest appeal of these tech stocks is not how they fight with each other but how they stand alone as virtual monopolies.
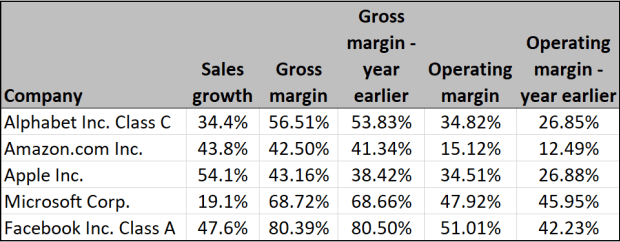
With that in mind, are year-over-year comparisons of gross margins and operating margins for Alphabet and four other trillion-dollar tech-oriented companies. You’ll see that GOOG sales growth metrics are in the lower portion of the Big Tech crowd, even if they are impressive when compared with other companies on Wall Street.
(FactSet)
A company’s gross margin is its sales, less the cost of goods sold, divided by sales. Many investors see this figure as a measure of pricing power. Alphabet is in the middle of the pack on this front, better than Amazon and Apple but behind Microsoft Corp.
MSFT,
and Facebook Inc.
FB,
It’s worth noting, that comparing only two periods may not be especially meaningful, but it is important to understand if there is a trend.
For instance, gross margin has expanded slightly but operating margin — that is, its earnings before interest, taxes and depreciation divided by net sales — has improved considerably year over year. It’s perhaps not unsurprising that AMZN is at the end of the list given its discount retail model, but the fact that Google’s “return on sales” for online advertising is not as strong as Facebook Inc. and it’s similarly ad-supported model may be worth watching.
Free cash flow
With many companies’ businesses tied to intellectual property and services, some investors think cash-flow generation can be more important than traditional measures of value like price-to-earnings ratios. This is particularly true in Big Tech where the old rules of industrial stocks may not offer the same level of insight into operations.
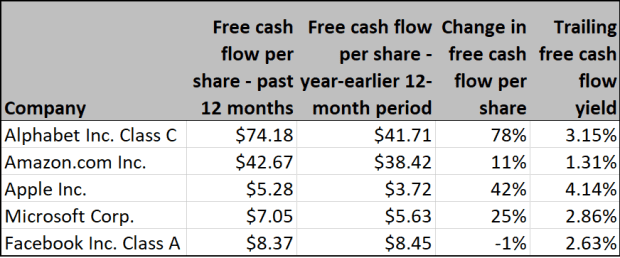
A company’s free cash flow (FCF) yield can be calculated by dividing its trailing 12 months’ FCF by the current share price. For Google-parent Alphabet and the four other large technology companies being compared here, FCF can fluctuate greatly from quarter to quarter. But for what it’s worth, GOOG is the biggest cash cow on this list from a per-share basis — and over the last year, grew significantly to boot. Its trailing yield is also second only to Apple.
Here are the specifics in free cash flow per share for the past 12 reported months from the year-earlier 12-month period, along with trailing 12-month free cash flow yields:
(FactSet)
Stock valuation and performance
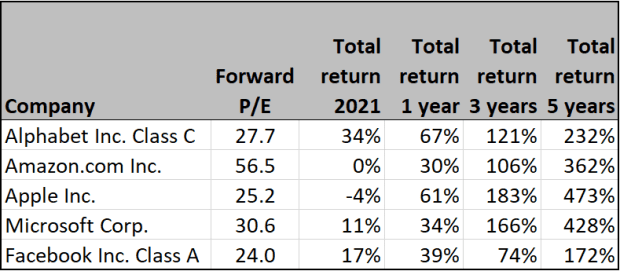
While old-school metrics are not perfect for any company, they are at least worth checking in on for Alphabet and its peers. So here are price-to-earnings (P/E) valuations for the same trillion-dollar stocks, based on consensus earnings estimates for the next 12 months among analysts polled by FactSet, along with total return figures through May 20:
(FactSet)
As with sales and margins, Alphabet is mostly in the middle of the pack on P/E ratio. And for the record, the forward P/E of the Nasdaq 100 Index as a whole is about 27.5 right now so it’s in line on that front, too.
From a share appreciation perspective, Alphabet’s recent performance has been good — even if its longer-term performance is admittedly not as impressive as its peers over the three- and five-year periods.
Wall Street’s opinion
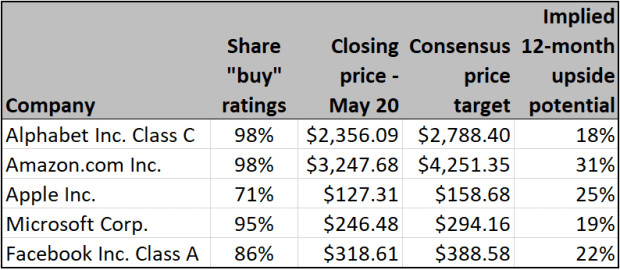
It’s not particularly surprising, given its history of growth and share appreciation, that Wall Street is enthusiastic about Alphabet. In fact, it’s almost unanimous that GOOG stock is worth owning right now with a stunning 98% of ratings at “buy” or equivalent.
But the devil is in the details, because when you look at the consensus 12-month price targets for the stock it doesn’t appear the “experts” are all that bullish. Current upside on Alphabet is predicted to be 21%, putting at the lower end of gains that folks are looking for across Big Tech. That’s nice upside, but still lower than others on the list.
Here’s a summary of opinion among Wall Street analysts polled by FactSet:
(FactSet)
Important dates
June 1 — Alphabet to present at Deutsche Bank Global Financial Services Conference
With reporting by Philip van Doorn.

