This post was originally published on this site
The Issue:
There are concerns about inflation rising, and perhaps even accelerating, fueled by an overheating economy as a consequence of the large fiscal stimulus, the Federal Reserve’s commitment to keeping interest rates low for an extended period, and pent-up demand for consumption that was foregone during the pandemic. The last bout of high and rising inflation, in the 1970s, was during a time of economic distress and only ended with a painful recession engineered by the Federal Reserve in the early 1980s.
Are we in for a similar episode today? While inflation has been high in the past few months, at least compared to its level since the Great Recession that began in 2008, several factors suggest that we should not be concerned about sustained and accelerating inflation—at least not yet.
Inflation was 4.2% in April 2021. Whether it is likely to continue increasing depends on different factors that contribute to a generalized rise in prices.
The Facts:
Inflation has been relatively low for about three decades, and especially quiescent over the past decade. Inflation is the rate of change of overall prices in the economy. The “headline” inflation rate is the rate of change of a basket of goods for a “typical” urban consumer. This has averaged 1.7% over the past decade. An alternative is the “core” inflation rate that strips out the prices of foods and fuels since these tend to be more volatile than other prices and, also, they can reflect factors other than the strength of the economy and the extent to which the economy is “overheating.”
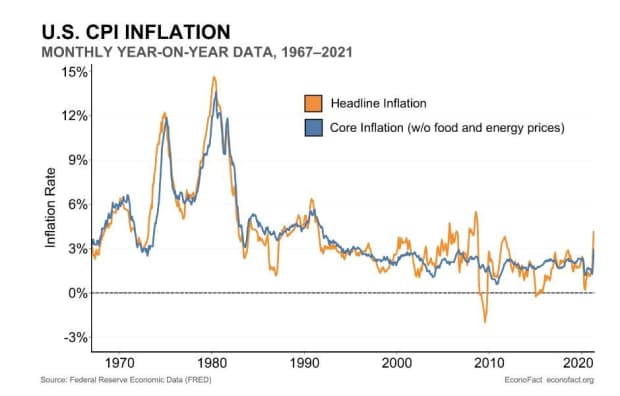
One striking aspect of inflation trends over the past 50 years in the U.S. is that inflation has been much lower since the mid-1980s and, even more so, since the onset of the Great Recession—to the point of raising concerns that inflation was too low. Over the last decade, inflation has averaged only 1.7%. Contrast this with the 1970s when headline inflation averaged 7.5%, or even the period from 2000 to 2008 when inflation averaged 2.6% (see chart).

There hasn’t been much inflation in the past 30 years. But note the recent uptick at the far right of the chart.
Econofact
Inflation has been rising over the past year, but this comes after especially low inflation in the immediate wake of the onset of the pandemic. The inflation rate from April 2020 to April 2021 was 4.2% and the month-to-month rate of inflation has been rising every month since December 2020. At the start of the pandemic the economy actually experienced price decreases, so the annual increase in prices seen since April is to some extent a catch-up in prices as the economy recovers from the pandemic.
In order to consider whether inflation is likely to continue increasing, it is important to look at the different factors that contribute to a generalized rise in prices. Economists’ preferred explanation for inflation, sometimes called the “expectations augmented Phillips curve”, looks to some combination of three factors.
The first is the degree of slack in the economy, which gauges to what extent the economy’s resources are being used. When firms use labor and capital very intensively, production costs tend to rise and firms have more room to raise the price of their products to cover the costs.
A second factor involves long-term expected inflation—businesses and people take into account the expected rate of inflation when making economic decisions, such as setting wage contracts or planning for product prices. These decisions, in turn, feed into the actual rate of increase in prices.
Finally, increases in the costs of inputs to the production process, including wage costs, can also drive inflation. The rise in oil prices in the 1970s, which fed into more widespread price increases, is a clear example of inflation driven by input costs.
How much slack is there in the economy? The extent to which the economy is overheating is measured by the output gap, the difference between actual national income (GDP) and potential GDP. Potential GDP is a counterfactual measure of what the economy could produce if land, labor and capital were used at their normal rates.
With the $1.9 trillion American Rescue Plan along with the $4 trillion during the previous administration, the Federal Reserve committing to low interest rates, and renewed consumer confidence and spending as the pandemic is being brought under control and vaccination is becoming more widespread, the output gap is expected to shift from an economy that is currently producing below potential to one in which production exceeds its normal rate. (I estimate that the economy is likely to shift from a negative output gap (-2.1% in the first quarter of 2021) to positive in the next few quarters using CBO estimates of potential GDP and the Wall Street Journal’s April survey of economists).
This could fuel inflation—however, the relationship between a strong economy and inflation, the Phillips Curve, has been very flat in recent years and inflation seems to be stubbornly resistant to both a strong and a weak economy.

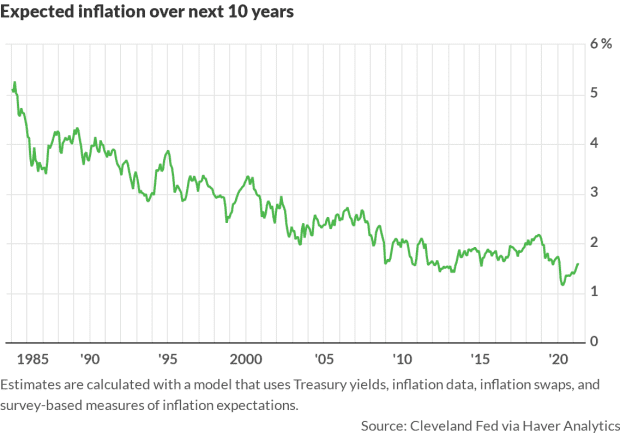
Longer-term inflation expectations remain modest despite the recent surge in prices.
Economists and households are marking up their expectations of inflation over the next year—but not by much. While in the relatively longer-term, financial markets project only a slight acceleration in inflation over the next five years. A survey of professional forecasters in May 2021 implied an expected inflation rate of 2.4% over the next year. A combination of financial market information and survey data indicates 1.7% over the next year to April. Households expect higher inflation—at about 3.2% to 3.3%–but on average households typically expect higher inflation than economists (by about a percentage point) and have consistently overpredicted inflation over the past two decades.
Longer-term inflation expectations have been relatively stable. Anticipated inflation rates inferred from financial markets—namely the gap between yields on Treasury bonds
TMUBMUSD05Y,
and Treasury inflation-protected securities (TIPS)
9128286N55,
—have risen substantially since the election. However, when accounting for risk and liquidity premia, the implied increase is small. This measure suggests longer term inflation has not changed much, perhaps by a third of a percentage point (after adjusting the calculation to account for risk factors).
Is the cost of inputs likely to continue rising? Production difficulties, from the temporary closure of the Suez Canal to the shortage of semiconductor chips, have raised concerns that bottlenecks in the supply chain could drive up critical input prices, feeding through into overall prices. Such price changes have been particularly noticeable in specific sectors, such as autos and construction.
The increase in energy prices between April 2020 and April 2021 was 25.1%. Some commodities such as lumber and copper have also seen marked increases—with consequences for prices down the line in construction and other sectors. But for these factors to have a persistent effect on inflation, prices would need to keep rising at these rapid rates.
Will too much money chasing too few goods cause inflation? There is also a so-called “Monetarist Approach” in which inflation is thought of as “always and everywhere a monetary phenomenon.” Under this view the rate of inflation corresponds to the rate of growth of the money supply minus the growth rate of the economy. The Fed has increased the broad measure of money supply, defined as the sum of currency and checking and savings deposits, by 28% since January of 2020.
The evidence has not been supportive of this explanation of inflation, however. Even before the Great Recession of 2007-09, the relationship between the money supply to GDP and changes in the price level had proven highly erratic, so much so as to prove an unreliable guide to inflation.
What this Means:
Inflation—both actual and expected—matters. Inflation makes it harder for consumers and workers and firms to distinguish between relative and general price changes. It also makes it more difficult to make plans for saving and investment. And, higher expected inflation raises borrowing costs for the government (although higher actual inflation erodes the real value of government debt). Finally, the Fed tends to respond to higher inflation by tightening monetary policy, which depresses economic activity. Hence, the stakes are high for avoiding a sustained acceleration in inflation.
So far, the actual growth in the price level has been temporary. Expectations of inflation remain muted because either the anticipated output gap or the responsiveness of inflation to the output gap are thought to be small, inflation expectations remain well-anchored, or all three.
Menzie Chinn is a professor of public affairs and economics at the Robert M. La Follette School of Public Affairs at the University of Wisconsin-Madison. His research examines the empirical and policy aspects of macroeconomic interactions between countries.
This economic memo was originally published by Econofact—Rising Inflation?
More on inflation
From Barron’s: Inflation, Jobs, and More to Watch for in Today’s Fed Minutes Release
William Watts: ‘Good’ inflation or ‘bad’? Investors are scared because they can’t tell difference just yet
Cullen Roche: You shouldn’t freak out over the CPI report — but this is what the Fed should do

