This post was originally published on this site
Amazon.com, despite its high valuation by the traditional price-to-earnings ratio, is a bargain stock for long-term investors. And this may be a perfect time to consider making a purchase.
Let’s begin with a Twitter posting from May 13:
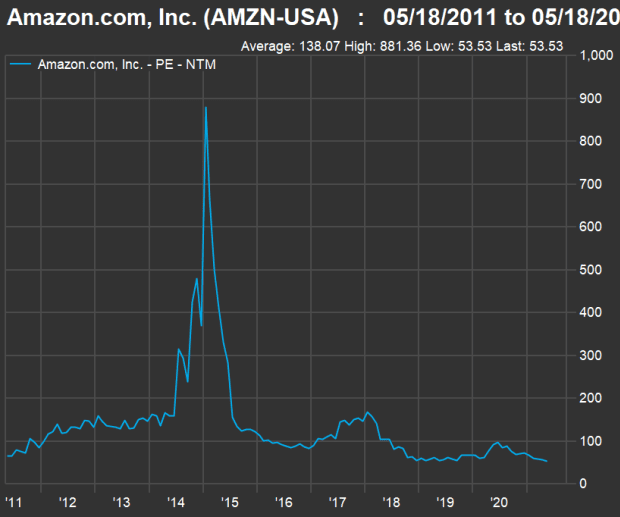
The forward price-to-earnings (P/E) ratio is the current share price divided by the consensus earnings-per-share estimate for the next 12 rolling months. If we pull our own 10-year forward P/E chart based on consensus estimates among analysts polled by FactSet, we can confirm Andreas Hansen’s observation:

(FactSet)
The current forward P/E of 53.5 for Amazon.com Inc.
AMZN,
is just above its low point for the past 10 years.
You might be saying that Amazon is expensive because its forward P/E is more than twice the S&P 500 Index’s
SPX,
21.5. But the forward P/E doesn’t take Amazon’s incredible growth rate into account.
If we look back over the past five full years, Amazon’s earnings per share have increased at a compound annual growth rate (CAGR) of 101.8%. That compares to an EPS CAGR of only 3.4% for the S&P 500.
What if we skip 2020, when Amazon made extraordinary gains, and reviewed 2016 through 2021? This way we bypass the pandemic year of 2020 and make our comparison with the expected bounce-back this year:

(FactSet)
This is a less-extreme comparison, but Amazon’s expected five-year CAGR through 2021 is much higher than that of the index.
But enough with looking back. We can look ahead and compare Amazon with other very large tech-oriented companies for a better picture of how inexpensive its shares are.
Amazon is on sale
A company’s PEG ratio is its price-to-earnings-to-growth ratio. It is calculated by dividing a P/E ratio by earnings-per-share CAGR.
To look forward three years, we can use consensus earnings estimates for calendar years 2021 and 2024. We’re using calendar years for the calculations to keep them uniform. Apple Inc.
AAPL,
for example, has a fiscal year that ends in September.
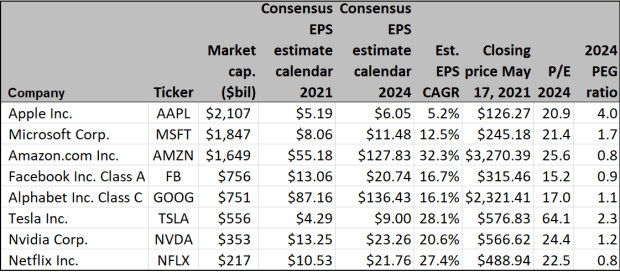
Sticking with Apple as an example, the company’s consensus calendar 2021 EPS estimate among analysts polled by FactSet is $5.19 and the consensus EPS for calendar 2024 is $6.05. Those numbers would make for an EPS CAGR of 5.2% from 2021 through 2024. The closing price for the stock on May 17 was $126.27, so the P/E based on the consensus 2024 EPS estimate would be 20.9. The PEG ratio is the P/E divided by the CAGAR of 5.2, or 4.0.
Starting with the S&P 500, here are 2024 PEG ratios for the eight largest tech companies by market capitalization for which consensus 2024 EPS estimates are available.

(FactSet)
Apple has the highest 2024 PEG ratio among the listed companies, because it has the lowest expected EPS CAGR by far.
Amazon is tied with Netflix Inc.
NFLX,
for the lowest 2024 PEG ratio of 0.8. But Amazon shines even brighter with the highest expected EPS CAGR from 2021 through 2024.
Facebook Inc.’s
FB,
2024 PEG ratio is only slightly higher at 0.9; it has the lowest P/E based on consensus 2024 estimates.
Following Tesla
TSLA,
stock’s amazing run in 2020, even with the 16% pullback this year, one might have expected the electric-vehicle maker to have the highest 2024 PEG ratio. But it is second-highest after Apple. Tesla also has the second-highest expected EPS CAGR.
Think long-term
This is obviously a very long-term way of looking at stock valuations. But that is appropriate, as stock investments (not trades) tend to work out best over longer periods. It’s easy to say “Amazon’s stock has done nothing for six months,” and it is true — the shares were up only 4.3% for the six months through May 17. But they were up 30% over the preceding six months. And they are up 15-fold for 10 years.
From day to day or month to month, you cannot predict how a stock will perform as an investment. But if a company continues to grow at a rapid pace as you hold the shares for many years, you have a good shot at making some money.
Don’t miss: These growth companies may be primed for massive stock buybacks

