This post was originally published on this site
You don’t need to worry that value’s resurgence over growth is a harbinger of trouble ahead. If anything, the relative performance of the U.S. stock market’s various style and sectors suggests the bull market will stay alive and well for at least a few more months.
This cheery forecast is at odds with the widespread opinion that value stocks’ relative strength is an early warning signal of market weakness. Investopedia gives voice to this narrative when it writes: “Value stocks tend to outperform during bear markets and economic recessions, while growth stocks tend to excel during bull markets or periods of economic expansion. This factor should, therefore, be taken into account by shorter-term investors or those seeking to time the markets.”
The historical data don’t support this narrative. Consider the relative performance of value and growth stocks since the 1920s, per data from Dartmouth College professor Ken French. During all complete market cycles since then in the calendar maintained by Ned Davis Research, value topped growth by an annualized average of 7.9% during bull markets—and lagged by an average of 2.5% annualized during bear markets. That’s just the opposite of what the prevailing narrative would have you believe.
Nor is it the case that value’s relative strength becomes stronger as bull markets near their end. When I focused on the last three months of all U.S. bull markets since the 1920s, the margin by which value beat growth was the same as it was, on average, across all other months of those bull markets. So value’s recent relative strength is not a source of concern in and of itself.
Sector rankings
There’s a more helpful way to slice and dice the market’s relative strength scoreboards to get an idea of where we are in the market cycle: Compare the sectors’ recent performance with relative strength rankings from the final three months of past bull markets. This is useful because the sectors undergo fairly predictable patterns of relative strength and weakness depending on where we are in that cycle.
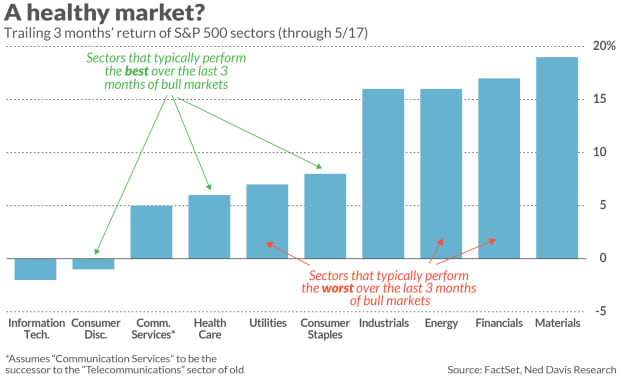
Sector relative-strength rankings currently do not suggest that a bear market is imminent. According to research conducted by Ned Davis Research, Consumer Discretionary, Health Care and Consumer Staples are the S&P 500
SPX,
sectors that have performed the best, on average, in the last three months of all bull markets since 1970. They have not been the best peformers in the past three months of this year, as the chart below shows. Among the 10 S&P 500 sectors, they currently are in 5th, 7th and 9th places for trailing three-month returns.

A similar story is told by focusing on the sectors that typically perform the worst in the last three months of bull markets. According to the Ned Davis data, they are Communication Services (assuming it to be the successor to the Telecommunications sector of old), Utilities and Energy. Once again we’re not seeing this pattern now: These three sectors currently are in second, third and sixth place, respectively, in a ranking of trailing three-month returns.
No indicator is foolproof, of course. But this one is supported by the historical data, which is not the case for the argument that value’s relative strength is an early warning sign of market weakness.
Mark Hulbert is a regular contributor to MarketWatch. His Hulbert Ratings tracks investment newsletters that pay a flat fee to be audited. He can be reached at mark@hulbertratings.com.
More: These are the 30 value stocks that top investment newsletters like best right now
Plus: Don’t be a sitting duck when this stock market rally fades — here’s what to do now

