This post was originally published on this site
How concerned should you be that the CAPE for the U.S. stock market is the highest in the world? I am referring to the cyclically adjusted price/earnings ratio (CAPE) made famous by Yale University finance professor (and Nobel laureate) Robert Shiller. It is conceptually similar to the typical P/E ratio, except that instead of using trailing 12-month earnings as the denominator the CAPE uses average inflation-adjusted earnings over the trailing 10 years.
The CAPE currently stands at 36.6 for the S&P 500
SPX,
according to Shiller’s latest calculations. That’s higher than 98% of monthly readings since 1881, and more than double the 140-year average, suggesting an extremely overvalued market.
The bulls have a standard comeback to this apparently high reading: The financial world has undergone major changes in recent decades, reducing the comparability of current CAPE levels with those of the distant past. Those include changes in accounting rules for calculating profits as well as the growth in intangible assets as a percentage of corporate net worth.
But this comeback doesn’t necessarily apply when comparing the U.S. market’s CAPE with those of other countries around the world. Now the comparison doesn’t extend across time but across countries — a contrast that Statistics 101 illustrates as the difference between time-series and cross-sectional analyses. Focusing on the cross section therefore means the lack of historical comparability is no longer a problem.
Let there be no doubt that the U.S. market’s CAPE is highest in the world right now. According to calculations from Barclays Bank, the average CAPE for 25 developed nations’ stock markets currently is 21.4, just over half of the S&P 500’s 36.6 reading.
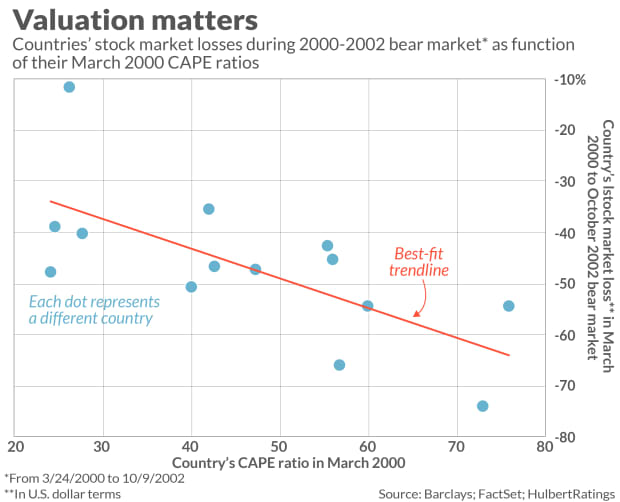
To appreciate how significant this difference is, I analyzed how countries’ stock markets performed during the bursting of the internet bubble two decades ago as a function of their CAPE at the beginning. Specifically, I was interested whether the countries with the highest CAPE at the top of the internet bubble lost the most in the ensuing bear market.
The answer is evident in the chart below. Each dot in that chart represents a different country; the red line is that which best fits the data. Notice the distinct downtrend in that line, which means that lower CAPEs were associated with smaller losses. Specifically, according to a simple regression model based on the chart’s data, a 10-point lower CAPE in March 2000 corresponded to a subsequent bear-market loss that was 8.1 percentage points smaller. This correlation is significant at the 95% confidence level that statisticians often use when determining if a pattern is genuine.

To be sure, the CAPE hasn’t worked this well in every bear market. For example, there appears to have been no correlation between CAPE in February 2020 and the magnitude of losses that various countries’ stock markets incurred during the waterfall decline through the March 2020 lows. But one can at least plausibly argue that that decline was caused by the severity of the pandemic lockdowns and limited by the size of the subsequent fiscal and monetary stimulus—neither of which is correlated with whether the stock market was overvalued.
This suggests that CAPE will be especially helpful in protecting you against bear markets caused by overvaluation, as happened after the internet bubble burst. Such an event could happen any time, judging by not just CAPE but a half-dozen other leading valuation indicators as well. So dismiss CAPE at your peril.
Mark Hulbert is a regular contributor to MarketWatch. His Hulbert Ratings tracks investment newsletters that pay a flat fee to be audited. He can be reached at mark@hulbertratings.com
Also read: One sure prediction about the stock market’s future is that it won’t be anything like the past
Plus: U.S. stocks have risen to all-time highs this year. Should you ‘sell in May and go away’?

