This post was originally published on this site
Amazon.com Inc. tends to be one of the most-searched-for companies on MarketWatch.
This quarterly review of Amazon’s stock will show comparisons of key metrics to watch and a summary of the company’s most important issues to help investors make better decisions.
These updates will also include comparisons of results to competitors. Keep in mind that no two companies are alike — even rivals don’t compete in every space. Any investor needs to do their own research to make informed long-term decisions.
Where Amazon fits in
Amazon
AMZN,
is the third-largest publicly traded company in the world, behind tech giants Apple Inc.
AAPL,
and Microsoft Corp.
MSFT,
(Read MarketWatch’s quarterly update on key metrics for Apple and Microsoft.)
But unlike those other two companies that have fairly defined flavors — Apple is an icon in consumer hardware and Microsoft is the gold standard in enterprise software — Amazon isn’t as easily categorized. It began as “Earth’s biggest bookstore,” according to an early slogan, before becoming a store for everything — and more recently, a cloud-computing leader, thanks to its Amazon Web Services division.
Key metrics
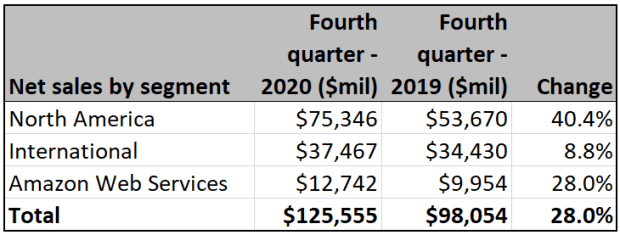
There are some similarities between AMZN and other “big tech” rivals, but a look at its segments shows the very unique nature of its massive operations. Amazon.com North American consumer sales include e-commerce transactions as well as sales at its brick-and-mortar Whole Foods grocery stores that were acquired in 2017. Everything sold outside of North America is classified under its International segment. Both of these segments exclude Amazon Web Services, however, which provides on-demand cloud computing and related services.
Sales growth
What’s particularly interesting about Amazon is how widely these segments vary in revenue and profitability trends. When you look at only revenue, North America sales is the business line to watch as it represents about 60% of the total top line at present and is still growing fast on top of that.
(Company filing)
Pricing power and profitability
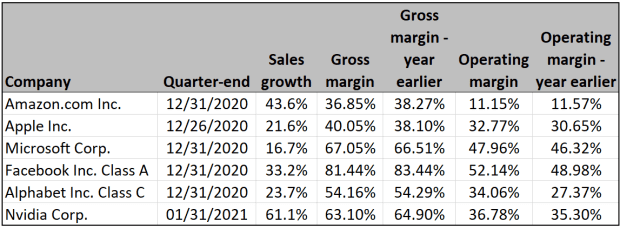
However, when you look at bottom-line impacts, the comparatively small AWS arm that accounts for only about 10% of sales delivers a massive 52% of total operating income, owing to juicy margins on this high-tech service arm.

(Company filing)
The International segment is operating at a modest loss as Amazon invests in growth plans overseas. In part because of this, AMZN has the lowest operating margin among Big Tech stocks. In fact, its fourth-quarter report shows overall margins had decayed even further from the prior year.
So while Amazon boasts an amazing history of sales expansion, it’s important to understand that it is also investing a lot of capital into these expansion efforts that ultimately offsets the relatively fat profit margins on the smaller, focused AWS segment.
(FactSet)
Free cash flow
Beyond profits and sales, many investors are interested in cash-flow generation metrics. In a nutshell, this figure is a sign of how much cash a company is generating after paying the costs of doing business. And based on the specific nature of Big Tech stocks from Amazon to Apple, free cash flow can vary significantly.
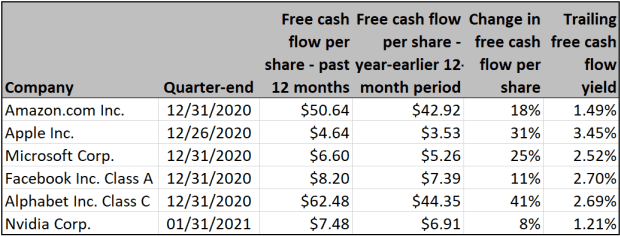
The good news for Amazon investors is that while sometimes profits can be thin, there is a ton of cash moving around. As a result, it has the second-highest free cash flow per share among its peers over the past 12 months.
Here’s a comparison of the six companies’ changes in free cash flow per share for the past 12 reported months from the year-earlier 12-month period, along with trailing 12-month free cash flow yields, based on closing share prices on April 26:
(FactSet)
Stock valuation and performance
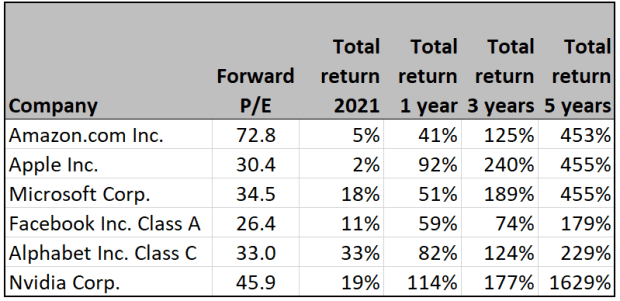
Following a more traditional valuation model, here are price-to-earnings (P/E) valuations for the six major tech stocks, based on consensus earnings estimates for the next 12 months among analysts polled by FactSet, along with total return figures through April 26.
(FactSet)
Once again, you’ll see that the big investments in Amazon and its comparatively smaller profits are reflected. AMZN has the highest P/E ratio of the bunch — but investors should remember that people have been maligning Amazon based on this metric for years and that hasn’t stopped the stock from consistently outperforming.
Apple also has the highest percentage of “buy” or equivalent ratings among this beloved group of companies.
Wall Street’s opinion
Here’s a summary of opinion among Wall Street analysts polled by FactSet:
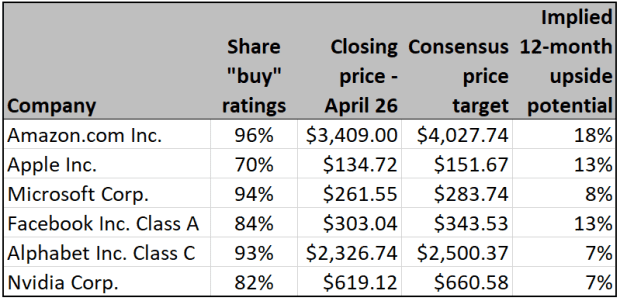
(FactSet)
As a group, analysts working for brokerage companies love Big Tech stocks. But Amazon stands atop them all with nearly universal support among all the experts covering the stock. Furthermore, the potential for upside based on the average 12-month price target is 18% — the highest in this group.
These are just estimates, of course, and there’s no guarantee AMZN will get there. But the consensus of optimism among Wall Street firms is noteworthy nevertheless.
Important dates
- April 29 — Amazon reports first-quarter results.
- May 26 — Amazon’s annual shareholders meeting.
With reporting by Philip van Doorn.

