It’s not a good sign that wide divergences between the Dow Jones Industrial Average
DJIA,
and the Nasdaq Composite Index
COMP,
have become almost commonplace.
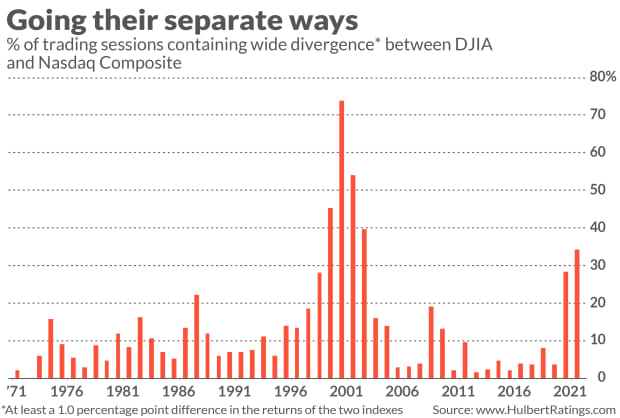
Consider the number of trading sessions in which there is at least one percentage point spread between the returns of these two indices. We’ve experienced two such days just this week alone. On Tuesday, the Nasdaq rose 1.1% while the Dow fell 0.2%. In Wednesday’s session the mirror opposite occurred, with the Nasdaq falling 1.0% and the Dow rising 0.2%.
Such broad divergences historically have been quite rare. Since the Nasdaq Composite was created in the early 1970s, just 12.8% of the trading days experienced such a wide divergence as investors experienced this week. So far this year, in fact, the proportion of these 1.0%-plus divergences has been 34% — almost three times greater. As you can see from the chart below, this year’s percentage is the highest on record except for the years associated with the internet bubble.

That’s a bearish parallel, to be sure. To go beyond the accompanying chart, I analyzed all U.S. market trading sessions since the early 1970s. Specifically, I calculated the correlation between the number of greater-than-one-percentage point divergences over the trailing six months and the stock market’s return over the subsequent six months. Sure enough, there was an inverse correlation — with a higher number of divergences associated with lower subsequent returns.
Interestingly, this inverse correlation showed up in the data regardless of whether the divergence was created because the Nasdaq Composite outperformed the DJIA, or the other way around. It is the divergence itself that appears to be bearish.
I had noted these divergences in a Barron’s column one month ago, and speculated then that the reason they were bearish is that a healthy market is one that is firing on all cylinders. Since then I have come to appreciate that an even more significant reason is that the divergences are a symptom of late-bull-market speculation from retail investors. The typical retail investor is far more interested in the companies that dominate the Nasdaq Composite than the blue chips included in the DJIA. So when retail trading volume rises, the Nasdaq Composite’s volatility rises more than the DJIA’s.
And let there be no doubt that retail trading volume is surging. Charles Schwab, the giant discount brokerage firm, reported earlier this week that it added 3.2 million new accounts in the first quarter, more than for all of 2020. Barron’s estimated that the Robinhood app was downloaded more than 3 million times in January alone.
Regardless of the source of the DJIA-Nasdaq divergences, however, my data show that they carry far more bearish significance for the Nasdaq Composite than for the DJIA. So one possible response to the growing number of wide divergences would be to tilt your equity holdings towards the large-cap high-quality stocks that dominate the DJIA.
But the broader investment lesson is that a market top of some significance is not unlikely.
Mark Hulbert is a regular contributor to MarketWatch. His Hulbert Ratings tracks investment newsletters that pay a flat fee to be audited. He can be reached at mark@hulbertratings.com
More: Why Generation ‘I’ — YOLO investors who’ve never seen a bear market — should worry us all

