This post was originally published on this site
OK, so here’s a quick brain teaser for all of us who have a 401(k) or other retirement portfolio.
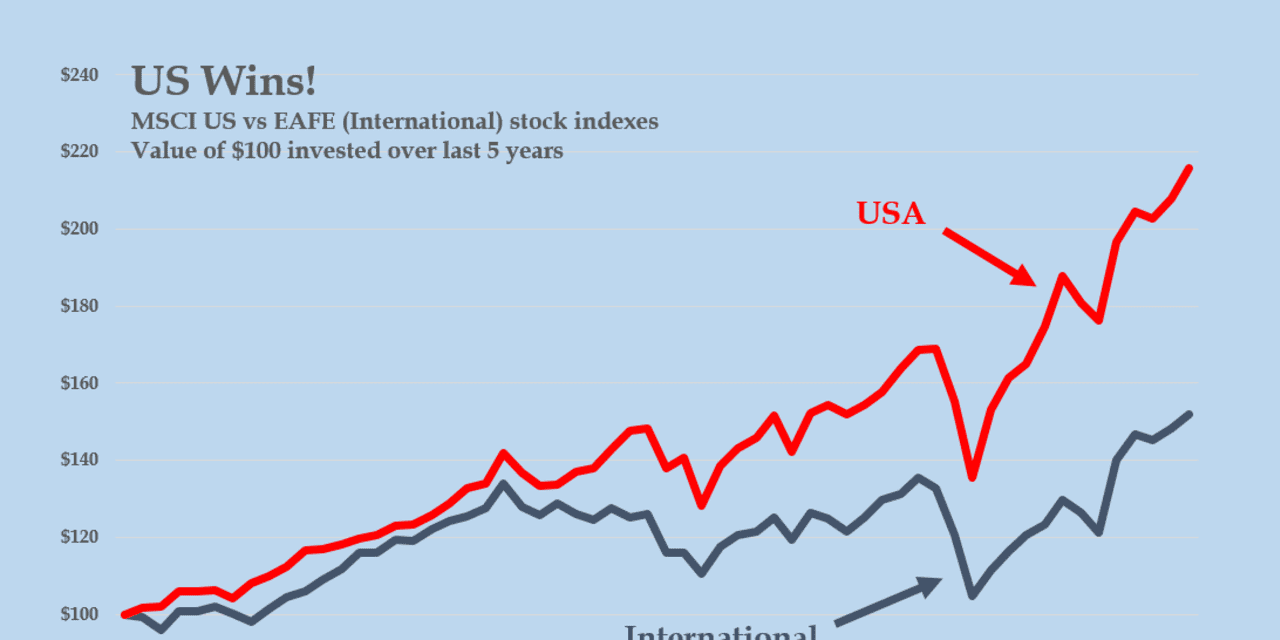
As we all know, the U.S. funds in our portfolios have been beating the pants off the international funds, and have been for months, years and more than a decade. In the past five years, for example, U.S. stock index funds such as the SPDR S&P 500 ETF
SPY,
and the Vanguard Total Stock Market Index Fund
VTSMX,
have generated about twice the total return of internationally-oriented equivalents, such as the iShares MSCI EAFE (Europe, Australasia and Far East) ETF
EFA,
or the Vanguard Total International Stock Index fund
VGTSX,
Go back to the start of 2010 and the U.S. funds beat their international counterparts by four to one.
Data from MSCI, the stock market data company, show that this performance gap goes back decades.
So, here’s the question.
Why?
That’s it. Why have U.S. stock funds done so much better than international stock funds?
That’s the challenge addressed by hedge fund honcho Cliff Asness in a remarkable new analysis with the brilliant title “The Long Run Is Lying To You”. And what he finds helps upturn much of what passes for conventional wisdom, on Wall Street and Main Street, about our retirement accounts.
If you think U.S. funds have done so much better because U.S.-based companies have produced more and faster-growing earnings per share than their international counterparts, think again, reports Asness.
If you think that U.S. companies have generated higher and faster growing dividends, that’s a bust too, reports Asness.
Actually, using data going back to 1980, he shows that the earnings and dividends of U.S. and international stocks (and funds) have been broadly in line. The superior underlying performance of U.S. companies, such as it is, accounts for a small fraction of their better returns.
The real explanation? Price.
From 1980 to 2020, “We see a giant repricing with the USA getting relatively much more expensive” compared with the rest of the world, writes Asness. Investors are simply willing to pay much more for each dollar of U.S. earnings versus international company earnings.
He illustrates this using one of the stock market’s favorite yardsticks, the so-called Cyclically-Adjusted Price-to-Earnings ratio, which compares a stock’s price with the company’s net income of the previous 10 years.
In 1980, U.S. and international stock indexes traded for about the same CAPE, reports Asness. Today, the CAPE on the U.S. market is twice that of the international average. This shift is gigantic—and is in addition to any changes in earnings themselves. It’s not so much that U.S. earnings have gone up so much more than international earnings, it’s that U.S. stock prices have gone up much more, in relation to their earnings, than international stock prices.
Over the period 1980-2020, this “valuation shift” has accounted for about 80% of the total U.S. outperformance, Asness reports. And from 1990, a halcyon period for U.S. stocks because of the Japanese bubble collapse, it still works out at about 75%.
In other words, U.S. stocks haven’t become more popular because their performance has been so good: Their performance has been so good because they’ve become more popular. We investors are all bidding up the price of U.S. stocks because we think they are “better,” and by bidding up the price we make them look better…which causes more people to want to bid up the price even further.
To my naive ear, this sounds suspiciously like a legal Ponzi scheme or a pyramid scheme or a bubble.
For those who were baffled by the brain teaser above, here’s a chance for a do-over. Just as U.S. stock funds have outperformed international stock funds in our portfolios, so exciting, go-go “growth” funds have done better than boring “value” funds. (So-called “growth” funds invest in (expensive, but fast-growing) companies of tomorrow like Tesla
TSLA,
while “value” funds invest in (cheap, but slower-growing) companies of today and yesterday like Ford
F,
)
Since the start of 2010, for example, the Vanguard Growth ETF
VUG,
has generated 75% higher returns than the Vanguard Value ETF
VTV,
Over the past five years growth has beaten value by a clear 100%.
But, once again: Why?
Why have growth funds been so much better an investment than value funds?
Asness runs the numbers, and finds the same answer. It’s not because of relative earnings growth or dividend payouts. Once again, he says, it’s because of price.
This time he uses another popular yardstick, comparing stock prices to the value of a company’s net assets.
From 1950 through around 1990, he calculates, U.S. “growth” stocks were on average four times as expensive as value stocks on this measure.
Today? They’re 10 times as expensive on average. That gap is as wide as it was during the dot-com bubble of 1999-2000, he says.
In other words, it’s the same paradox or illusion. We think “growth” stocks have become more popular because their performance has been so good. But actually the main reason their performance has been so good is that they’ve become more popular. The investment fashion for growth stocks isn’t so much the reflection of their superior performance as the cause. We are paying more and more for the privilege of investing in the hopes and dreams of tomorrow.
What this means is that if we expect U.S. stocks and growth stocks to continue to do as well in the future as they have in the past, we have to embrace heroic assumptions. Not only do they have to stay in fashion, they have to become even more in fashion. And heaven forbid if they actually fall out of fashion.
Luckily, fashion doesn’t go in cycles, and what’s popular today will doubtless be what’s popular tomorrow. Just ask any young person.
