This post was originally published on this site
The theme of a market pivot to value stocks from growth stocks is something you might be sick of seeing in the financial news media. But maybe this time it’s for real.
If you think it is time for a strategy shift, there is a list of analysts’ favorite value stocks below.
On Feb. 22, the Nasdaq Composite Index COMP, -0.50% pulled back 2.5%, while the high-flying Nasdaq-100 Index NDX, -0.22% sank 2.6% and the Dow Jones Industrial Average rose DJIA, +0.05% slightly.
One day’s action doesn’t signal a trend, but the broad market indexes typically rise and fall together. So it was an unusual day. And if we look back three weeks through Feb. 22, the Dow was up 4.3%, while the Nasdaq rose 1% and the Nasdaq-100 was down slightly.
Other factors that may favor a value approach at this time include increasing oil prices and rising interest rates.
Rising rates means some investors, at least, are worried about inflation. And that sets up a friendly environment for value stocks.
The setup — tech has led and valuations have been stretched
The Dow, with its conservative group of 30 blue-chip stocks, including some slow-growers and even one experiencing a perennial decline in sales (International Business Machines Corp. IBM, -0.12% ), has underperformed the broad indexes by wide margins in recent years as rapidly growing technology companies have led the bull market.
Here are five-year returns (with dividends reinvested) for the Dow, Nasdaq, Nasdaq-100 and S&P 500 SPX, +0.13% indexes:
| Index | Total return – 5 years | Average annual return – 5 years |
| Dow Jones Industrial Average | 113% | 16.4% |
| Nasdaq Composite Index | 212% | 25.6% |
| Nasdaq-100 Index | 230% | 26.9% |
| S&P 500 | 120% | 17.1% |
| Source:FactSet | ||
These are all remarkable figures — even for the Dow. The other indexes are all weighted by market capitalization, emphasizing the rapid growth of the FAANG stocks (Facebook Inc. FB, +2.12%, Apple Inc. AAPL, -0.11%, Amazon.com Inc. AMZN, +0.43%, Netflix Inc. NFLX, +2.32% and Google holding company Alphabet Inc. GOOGL, +0.29% ). (The Dow isn’t a “value-only index,” as its components include Apple, Microsoft Corp. MSFT, -0.53% and another notable tech grower, Salesforce.com Inc. CRM, -2.20%, but it trades as one.)
Now let’s take a look at growth and value. The Russell 1000 Index RUI, +0.06% is made up of the 1,000 largest U.S. stocks weighted by market cap, with the group rebalanced once a year each June. Selected from the Russell 1000 are the Russell 1000 Growth Index RLG, -0.25%, which has 453 stocks, and the Russell 1000 Value Index RLV, +0.38%, which has 849 stocks. The groups overlap, with 291 stocks in both. You can read how FTSE Russell describes the makeup of its indexes here.
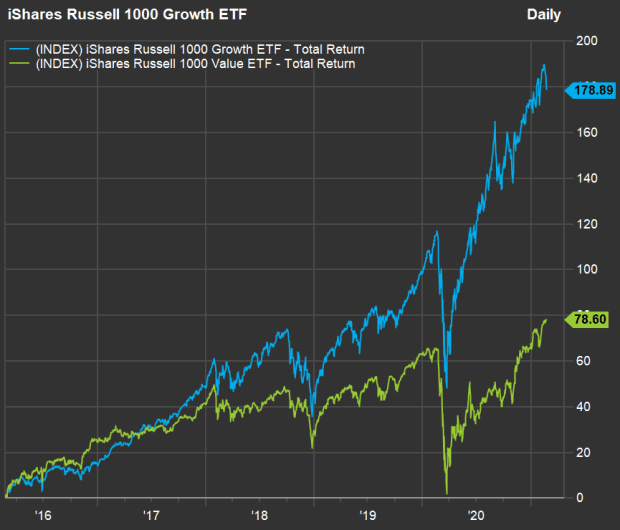
Here’s how the two groups have performed over the past five years, as represented by the iShares Russell 1000 Growth ETF IWF, -0.27% and the iShares Russell 1000 Value ETF IWD, +0.33% :

(FactSet)
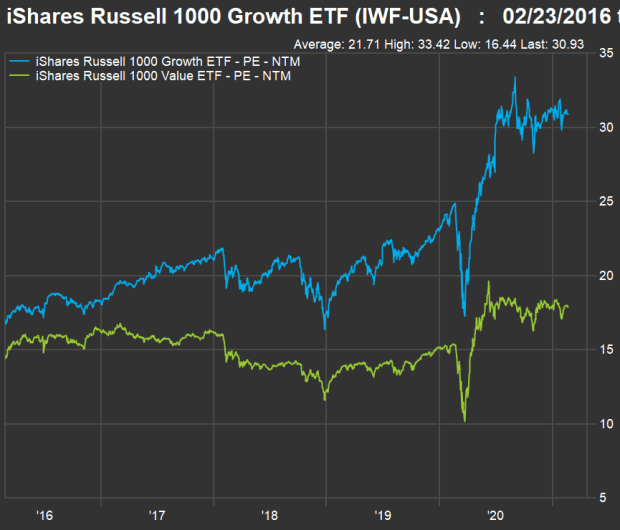
And here’s a comparison of the movement of their forward price-to-earnings ratios:

(FactSet)
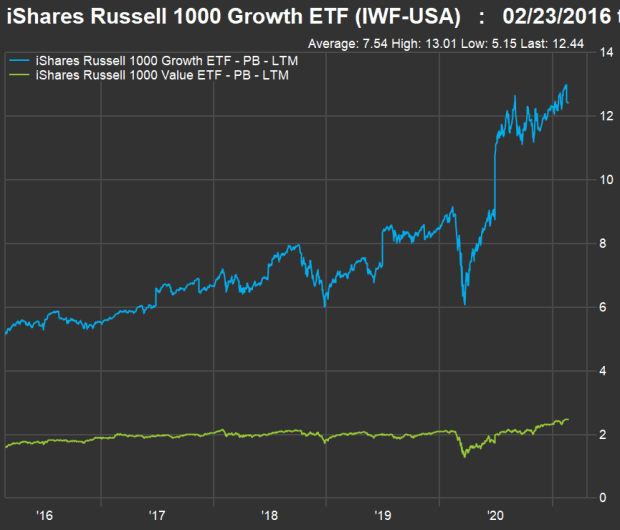
And finally a comparison of the movement of their ratios of price to book value.

(FactSet)
For five years, the Russell 1000 Growth group has more than doubled the return of the Value group. The Growth group’s forward P/E ratio has increased to 30.9 from 16.7, while the Value group’s forward P/E has increased to 15.5 from 14.4. The Growth group’s price-to-book ratio has increased to 12.4 from 5.2, while increasing to 1.5 from 1.6 for the Value group.
So the valuation ratios are up significantly for both groups, but there is no comparison in degree — Growth has been a runaway success and as a group appears to be expensive. The Growth group’s numbers are also distorted by its cap weighting. The top five stocks in the iShares Russell 1000 Growth ETF make up 33% of the portfolio, with the largest holding, Apple, weighted 10.7%. In the iShares Russell 1000 Growth ETF, the top five make up 10.5% of the portfolio, with the largest holding, Berkshire Hathaway Inc. BRK.B, +0.23%, at 2.5%.
Wall Street’s favorite value stocks
Among the 849 stocks in the Russell 1000 Value Index, there are 639 with ratings from at least 11 analysts polled by FactSet. If companies with forward P/E ratios above 20 are excluded (along with those with no available forward P/E ratios, as that implies negative earnings for the combined next four reported quarters), the list is reduced to 298 stocks.
Here are the 25 remaining stocks rated “buy” or the equivalent by at least 80% of analysts with the most 12-month upside potential implied by consensus price targets:
Scroll the table to see all the data.
General Motors Co. GM, -1.67% is an interesting example of a value stock. Even though the shares have risen 25% this year, the stock only trades for 10 times the consensus forward earnings estimate and 1.6 times book value.
As always, if you see any stocks of interest, your next step should be to do your own research and form your own opinion about a company’s long-term viability.

