This post was originally published on this site
It’s a small-cap world right now for U.S. stock-market traders.
As impressive, or shocking, as the gains by large-cap benchmarks, including the S&P 500 SPX, -0.14% (up 2.4% year to date and 78% from its March 2020 pandemic low) have been, the small-cap benchmark Russell 2000 RUT, -0.36% has left them in the dust.
The Russell stands nearly 16% higher for the year to date and has rallied more than 130% off its March lows.
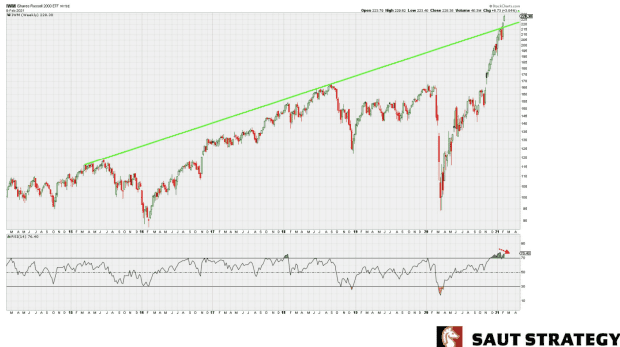
And recent gains have put the index in breakout territory, unlike the S&P 500, which has yet to break above major resistance lines, said technical analyst Andrew Adams of Saut Strategy, in a Wednesday note.
He charts the breakout of the iShares Russell 2000 ETF IWM, -0.18% below:

Saut Strategy
“This is a positive signal, though it does lose some of its bullish impact due to the index already being so extended,” he wrote, noting a slight negative divergence between the price and the relative strength index (shown in the lower panel), which had pushed into overbought territory.
For now, traders “have to assume this breakout sticks until it doesn’t,” he said, noting that the ascending line in the chart, which had previously served as resistance, will now be viewed as support. For now, the path of least resistance is higher, he said, while a drop through the line would offer a “red flag.”
Major U.S. stock indexes were slightly lower in choppy trade Wednesday, with the Dow Jones Industrial Average DJIA, +0.03% down 5 points, or less than 0.1%, while the S&P 500 declined 0.2%. The Russell 200 was off 0.3%.
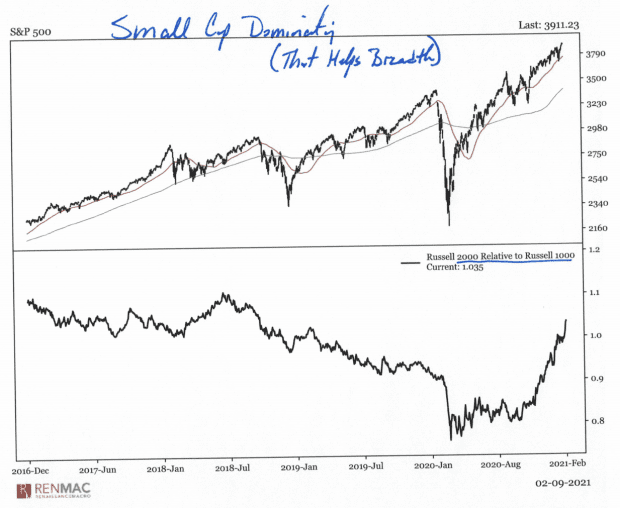
Jeff deGraaf, founder of Renaissance Macro Research, observed in a Wednesday note that small-caps are dominating the relative performance charts, “basically the smaller the better.” The bottom panel of the chart below tracks the Russell 2000 versus the large-cap Russell 1000 RUI.

Renaissance Macro Research
The small-cap gains have helped push RenMac’s NYSE breadth indicator into new high territory, he said, while the firm’s IPO index has made a new relative strength high. Breadth is a measure of how many stocks are participating in a move in an index or on an exchange.
DeGraaf also pushed back against arguments that concentrated outperformance by small-caps is a danger.
Such concentration, in fact, is a regular feature of rallies, he said, arguing that increased breadth courtesy of the small-cap rally is a reassurance. Investors should instead worry when breadth is weak and just a few names are leading equities higher as the rest of the index loses money.
The speed of the small-cap rally, however, is making some chart watchers nervous.
The move has accelerated over the past week, with the Russell 2000-tracking IWM ETF up 11% in the seven day stretch ending Tuesday (see chart below), noted Mark Arbeter, president of Arbeter Investments LLC, in a Wednesday note.
“That’s the largest seven-day jump since coming out of the October bottom,” he said. “Thrusting out of a bottom is bullish and quite common, but thrusting after a three-month rally and going parabolic after a big run is a bit worrisome.”

