This post was originally published on this site
Don’t let the green energy revolution fool you into thinking crude oil prices no longer have much to say about the economic outlook.
So cautions Nicholas Colas, co-founder of DataTrek Research, in a Tuesday note that takes a close look at oil market fluctuations and how they stack up versus past economic cycles.
Colas noted data from the U.S. Energy Information Administration showing that the world consumed an estimated 96 million barrels a day of petroleum and liquid fuels in November 2020. While that’s down 6 million barrels a day from November 2019, it’s up 2.5 million barrels a day from the third quarter of 2020.
“Energy demand is clearly coming back as global economies stabilize,” he said.
It’s certainly been a wild year for oil prices.
The sudden stop in the global economy in February and March as a result of the COVID-19 pandemic — combined with a spectacularly ill-timed price war between Saudi Arabia and Russia that flooded the world with unneeded crude — sent crude prices skidding in the spring, with the nearby contract for the U.S. benchmark trading and settling in negative territory for the first time ever.
Oil eventually rallied, helped by supply cuts by the Organization of the Petroleum Exporting Countries and its allies, a group known as OPEC+, as well as a pickup in business and consumer activity, particularly Asia.
Optimism fueled by progress toward COVID-19 vaccines was credited with giving oil a significant lift last month as traders bet on a wider recovery in the global economy while looking past the potential near-term hit to demand from a sharp rise in infections in the U.S. and Europe.
Brent crude BRNG21, -0.18%, the global benchmark, neared the $50 a barrel level earlier this week, while the U.S. benchmark, West Texas Intermediate CL.1, -0.35% CLF21, -0.35% traded above $45 a barrel — marking eight-month highs.
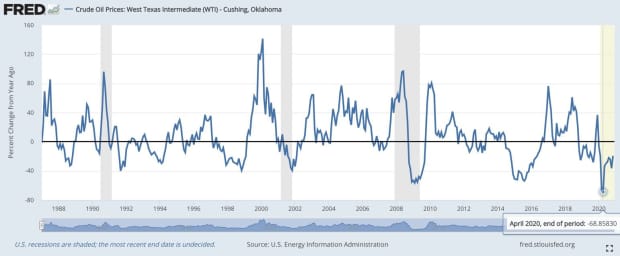
In the note, Colas referenced the chart below, looking past the market’s recent fluctuations to track price swings, as measured by the year-over-year percentage change, back to 1987:

Note the April 2020 decline of 69% was the steepest 1-year fall on record, Colas said, worse than the postrecession declines seen in 1991, 2001 and 2009, as well as the aftermath of the 1998 Asia crisis and the end of the China-related commodity bubble in 2015.
The chart makes clear, he said, that oil prices recover when the global economy recovers. They don’t always make new highs, Colas noted, adding that the June 2008 record price of $140 a barrel might never be broken, but they eventually do go on to post year-on-year increases.
Crude hasn’t done that yet. WTI futures, based on the most actively traded contract, remain down more than 22% year over year. Colas noted that, based on history, it usually takes oil around 10 months to turn positive after hitting its year-over-year low.
If that holds up, oil would be on track to turn positive year-over-year in February, implying a price for WTI just north of $50 a barrel. That seems a “safe bet” with WTI already trading around $45 a barrel, he said. It also validates the idea that another market, in addition to the stock market, “is confident in a ‘normal’ recovery to a very abnormal recessionary year.”
In the same note, DataTrek’s Jessica Rabe observed that just four names — Boeing Co. BA, -2.34%, Goldman Sachs Group Inc. GS, +1.52%, Walt Disney Co. DIS, +0.50% and Honeywell International Inc. HON, -0.19% — were responsible for the Dow Jones Industrial Average making new highs since breaking out in mid-November, reflecting investor confidence in a U.S. economic recovery.
Oil was putting in a mixed performance Wednesday, despite data that showed a sharp and unexpected rise in weekly U.S. crude inventories. Stocks were lower, a day after the S&P 500 SPX, -0.96% and Nasdaq Composite COMP, -1.94% closed at records. The Dow Jones Industrial Average DJIA, -0.54% closed at a record Friday.
“We’re not giving up on using the price of oil as an economic indicator. We’ve seen too many cycles to make that mistake,” Colas wrote.


