This post was originally published on this site
Stocks are on a tear on hopes for treatments and vaccines that can help end the current public-health crisis, but fears that equity-market valuations on Wall Street have gotten rich and well ahead of themselves continue to trouble many within the investment community.
However, James Paulsen, chief investment strategist at Leuthold Group, in a research report published Monday, says that nontraditional ways of assessing how pricey stocks have gotten may be warranted, given the nature of the biological disaster that helped to spark the rout in markets back in March.
“ Nearly every traditional valuation measure suggests the stock market is trading near all-time record levels,” wrote Paulsen.
“If conventional valuation models are accurate, the stock market appears to have very little upside potential and, ultimately, considerable downside risk,” he said.
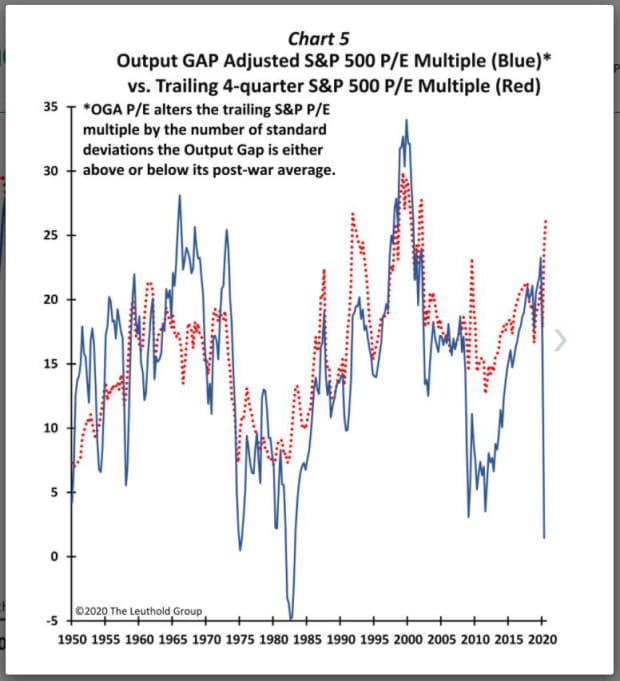
Indeed, traditional methods of valuing the market, like price-to-earnings, put equities at a P/E of 26, representing the richest level for the index since the dot-com bubble, according to Leuthold (see chart below).

The Leuthold Group
That said, Paulsen suggests one way of thinking about valuations as, perhaps, a guide to keeping an open mind about the possibility that stocks could have more room to run in this current environment.
“The goal is not to produce a new ‘best’ valuation technique superior to all others. Rather, the output gap adjusted PE multiple,” he wrote.
Paulsen turns to what he describes as the output-gap-adjusted P/E multiple, or OGA P/E, which calculates the percent difference between the current level of real gross domestic product and its estimated potential level if the economy were operating at full employment and adjusting the trailing P/E based on the degree to which the output gap trails the average since 1950.
“Specifically, if the output gap is average, no adjustment to the PE multiple is made,” the analyst explained.
“However, if the output gap is 1 standard deviation below average, the traditional PE is lowered by 1 standard deviation; if the output gap is 1 standard deviation above average, the traditional PE is raised by 1 standard deviation,” he said.
By this measure, the S&P 500 P/E on an output-gap-adjusted basis is far lower than current methods suggest, pointing to the cheapest levels since between 1974-1982 (see attached chart).

Paulsen acknowledges that this approach is unscientific but believes it is a starting point to talk about the richness of equities, with some hope for the bulls for the possibility that they continue to defy gravity.
“Although the S&P 500 is nowhere near record cheapness at this time, the OGA PE may be correct with indicating it is perhaps cheaper than most appreciate,” he wrote.
“In each of the previous cases, despite the stock market’s gaudy valuation, a bull market ensued and lasted for several years. Could this happen again today?” Paulsen asked.
On Monday, the S&P 500 index SPX, +0.57% and the Nasdaq Composite Index COMP, +0.16% were climbing to new all-time highs, while the Dow Jones Industrial Average DJIA, +0.80% was trading within 5% of its Feb. 12 record closing high.


