This post was originally published on this site

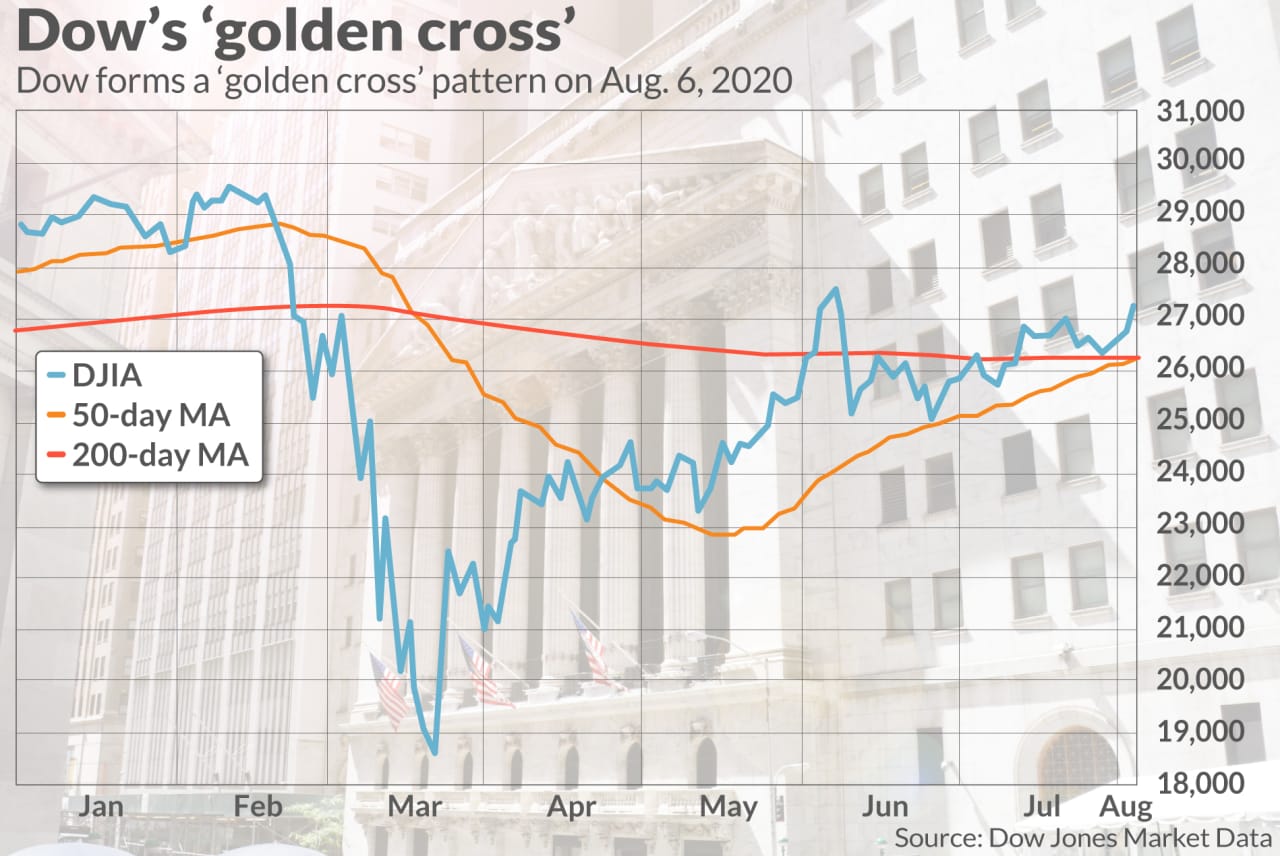
A golden cross formed in the Dow Jones Industrial Average DJIA, +0.68%, more than five months after a bearish chart pattern materialized in the aftermath of the carnage wrought by the COVID-19 pandemic.
A golden cross occurs when the 50-day moving average for an asset price trades above the 200-day MA, while a so-called death cross, comparatively, is when the 50-day falls below the long-term average.
On Thursday, the Dow’s 50-day stood at 26,251.34, and the 200-day moving average was at 26,229.91, according to FactSet data, marking the first time the short-time moving average has punched up above the longer-term average since March 20, and forming a chart pattern that is widely regarded as signaling that a trend higher for stocks appears to be at hand.
As MarketWatch’s Tomi Kilgore notes, crosses, overall, aren’t necessarily good market-timing indicators, however, as they are well telegraphed, but they can help put an asset’s move into perspective.
The last golden cross for the Dow occurred on March 19, 2019 and led to a steady rally for stocks until the death cross that formed nearly exactly year later in the wake of the pandemic.
Read: MarketWatch’s snapshot of the market for Thursday
The golden cross for the Dow comes about a month after a similar cross occurred in the S&P 500 index SPX, +0.64%.
Despite continued weakness in the economy, with the spread of the COVID-19 epidemic in many parts of the U.S. and the world, stocks have still climbed, boosted by government spending and Federal Reserve support for markets.
Technology names have been at the vanguard of the rally from the lows that were put in U.S. markets back in March as they benefited from work-from-home orders while businesses were shut down. However, the perception that technology-related companies are better situated to prosper in the aftermath also has helped the tech-heavy Nasdaq Composite Index COMP, +0.99% to register 31 record closes so far in 2020 while the S&P 500 and Dow have lagged behind.
The Dow, made up of 30 companies, has the lowest concentration of so-called technology or technology related companies and is a price-weighted gauge so its performance has been slightly weaker than those for the S&P 500 and the Nasdaq.
More than half of the Nasdaq comprises tech-related companies while more than a quarter of the S&P 500 consists of tech names.
Only a fifth of the Dow is tech, including Microsoft Corp MSFT, +1.60%. Apple AAPL, +3.48%, Cisco Systems CSCO, +0.93%, Visa V, +1.36%, International Business Machines IBM, +0.53% and Intel Corp. INTC, -0.04%
Those behemoth companies have helped the overall market mount a recovery from the coronavirus-induced lows, and as a result tech-leaning indexes have risen by the most.
The Nasdaq has surged by nearly 62% since its March 23 low and the S&P 500 has climbed almost 50%.
The Dow, isn’t far behind, and has gained 47% since its late-March nadir.
That said, the golden cross formation may suggest to some that the 124-year-old blue-chip index isn’t far from notching its first record since Feb. 12. The Dow stands about 7.5% from its all-time high, while the S&P 500 is about 1.3% from its Feb. 19 record closing high.
To be sure, a rejection of the golden cross isn’t unprecedented. A golden cross formed in January of 2016 but the Dow fell back into a death cross before carving out a new high, according to Dow Jones Market Data.

