This post was originally published on this site
Gold is on a historic tilt, surpassing records that have stood for decades and taking aim at a psychologically round-number level above $2,000.
The rush for bullion, unsurprisingly comes amid the worst public-health crisis in generations, but what does the climb in the centuries-old haven asset mean for stocks over the longer term?
Gold GOLD, +2.19% has traditionally rallied as stocks have fallen because of the yellow metal’s status as a safe play during times of uncertainty.
Read: Rising Price of Gold Brings Miner Newmont’s Earnings in Right on Target
However, gold has climbed more than 26% as U.S. equities have recovered from a low on March 23 during the worst of the coronavirus crisis. As gold rose, the S&P 500 index SPX, +0.76% climbed nearly 45%, the Dow Jones Industrial Average DJIA, +0.43% has advanced 40%, and the technology-heavy Nasdaq Composite Index COMP, +1.48% rallied by almost 55% over the same period.
Those tandem moves have raised the hackles of investors who fear that gold is signaling that stocks are overpriced as the economy is still reeling from the COVID-19 pandemic that resulted in a record 32.9% annualized decline of GDP in the second quarter, representing the fastest rate of quarterly decline on record using data going back to 1947.
Ryan Detrick, chief investment strategist for LPL Financial, in a recent blog post, noted that gold and stocks can rise in tandem, despite the perception that the asset prices are inversely correlated.
Correlations measure how asset prices move in relation to one another. A correlation of 1 would mean that stocks and gold move in perfect unison, while a correlation of zero indicates no relationship; and a correlation of negative 1 indicates that assets move in the exact opposite, or inverse, direction.
Gold’s rolling 100-day correlation with the S&P 500, for example, is 0.25, suggesting a slight positive relationship between prices of bullion and the broad-market benchmark over the past decade, according to Dow Jones Market Data.
However, over a 50-day rolling average, the correlation is negative 0.23 and negative 0.046, or nearly zero, over a 20-day rolling average, implying nearly no correlation to a slight inverse correlation over the midterm.
Detrick says that the tandem gains for gold and stocks is fairly rare but could herald a further rise in both assets, rather than necessarily suggesting an ominous outcome for surging equities.
“Think about this: 2020 is the first year since 1979 to have both gold and the S&P 500 make new highs during the calendar year,” he said.
“It is widely believed that stronger gold likely means something is wrong in the markets and investors are more defensive, but it might not be that simple,” Detrick wrote.
The LPL strategist said that when this condition of rising gold and stocks occurred more than four decades ago, both assets enjoyed double-digit returns.
“Gold added another 17% and the S&P 500 was up 26% in 1980,” he said.
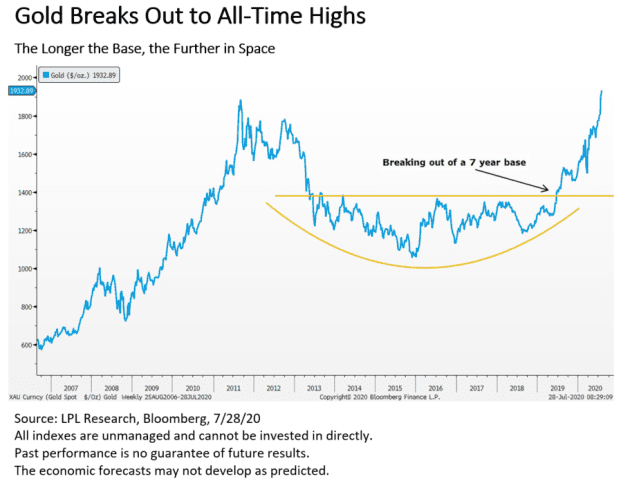
That said, data show that gold has tended to continue to rally when it starts to trade in record territory, while stock price rallies eventually peter out. A chart from Detrick highlights that gold has build up a seven-year base, which could suggest a lengthy and potent rally for the precious metal (see attached chart):

There isn’t a huge sample size of data in which the pair of gold and equities were both trading near records but between 2007 and 2011, a period in which there were six record stretches for bullion, the average return for gold was 14.6%, compared with a loss of 0.23% for the S&P 500, according to Dow Jones Market Data.
It is worth noting that when gold hit a record back in 2007, it was its first since 1980.
Gold has held its price range since the first financial crisis back in 2007 and has gained momentum as the Federal Reserve and the U.S. government have doled out trillions in funds to help limit the economic harm from the pandemic.
So-called money printing has been one of the factors that gold bulls point to when they make the case for further runs for the metal. The Fed also has communicated its intention to support financial markets by keeping rates uber-low, with benchmark federal funds rates a range between 0% and 0.25%.
On top of that, the Fed has been steadily scooping up assets, including debt, helping to keep the 10-year Treasury note TY00, +0.04% TMUBMUSD10Y, 0.537% at or below 0.60%.
That is an environment that strategists say can support both gold and stocks because low yields in government debt can drive investors into riskier assets like stocks but that setup also makes buying gold, which doesn’t offer a coupon, more compelling to potential buyers.
A bout of weakness in the dollar DXY, +0.46%, which has been trading at around a two-year low, compared against a half-dozen rival currencies, as measured by the ICE U.S. Dollar Index, has also been supportive for gold.
The weaker dollar has made gold more appealing because bullion is usually priced in dollars. And a weaker buck can also support shares of companies that have exposure to markets abroad, making their goods and services more attractive to overseas clients.
It is unclear how long gold and stocks can sustain their current trends, particularly during a period in the market where the coronavirus crisis has clouded the economic outlook and stoked unusual asset moves.
“The takeaway: Gold’s rally is the latest in a long list of unusual market moves that make us nervous,” wrote Lindsey Bell, chief investment strategist at Ally Invest, in a Friday research note.

