This post was originally published on this site
https://i-invdn-com.akamaized.net/news/LYNXNPEB8F145_M.jpg
That was the warning from Bloomberg Intelligence’s Gina Martin Adams 48 hours ago, just as the S&P 500 Index embarked on what seems likely to be a three-day decline, the longest losing streak since early March. In her view, investors were too optimistic and sentiment was running hot, a recipe for a pullback.
“The strong surge since March lows has finally resulted in an overheated momentum signal, and combined with extremely bullish options positioning, suggests stocks are likely to go through some short-term consolidation,” the chief equity strategist wrote Tuesday.
Hints the stock market was looking stretched were abundant. Martin Adams pointed to the S&P 500’s 14-day relative strength index, or RSI, punching above the critical overbought threshold for the first time since the rally began in March. She also highlighted the Cboe Equity Put/Call Ratio, which measures the relationship between bearish and bullish options, at the lowest level since 2011.
On Monday, the S&P 500 capped its fastest 50-day rally since the Great Depression to wipe out all its losses in 2020. At one point, there wasn’t a single stock in the benchmark that was lower since the rebound began. The Nasdaq 100 surpassed 10,000 for the first time ever, and by Wednesday’s close the index was up 16% this year.
During the runup, the fingerprints of retail investors were everywhere — with frenzied gains in everything from airlines and cruise stocks to companies in bankruptcy and a Chinese real estate firm with a name similar to the popular “Faang” grouping of U.S. tech stocks. Now, after the bets of individual investors looked prescient, they’re experiencing what it’s like to be on the losing side of a trade.
A Goldman Sachs (NYSE:GS) basket of stocks beloved by retail investors — which includes the likes of Royal Caribbean (NYSE:RCL) Cruises Ltd., United Airlines Holdings (NASDAQ:UAL) Inc. and Boeing (NYSE:BA) Co. — has dropped 13% since Tuesday, the most since just before the market’s bottom in March. The group rose and fell with the S&P 500 in 11 of the past 12 sessions, a stretch of near lock-step moves not seen since December.
The pain has been worse in companies that have seen individual investor interest surge in recent weeks. After bankrupt Hertz Global Holdings (NYSE:HTZ) Inc. rose 577% in the three days through Monday and tens of thousands of users of the Robinhood investing app added the stock to their portfolios, half those gains have been wiped out.
In the last three days, the U.S. Global Jets ETF, which has seen its assets surge in recent weeks, is down 20%, the worst stretch since March 20. Over the same time period, American Airlines (NASDAQ:AAL) Group Inc., Delta Air Lines Inc (NYSE:DAL). and Carnival (NYSE:CUK) Corp. have all plunged more than 22%. Each rank high on the list of stocks most favored by retail investors. According to website Robintrack, which tracks Robinhood’s data but isn’t affiliated with it, roughly 500,000 or more users of the app hold each of the three stocks.
Momentum was running hot across large swaths of the market at the week’s start. At Monday’s close, 224 members in the S&P 500 had their 14-day RSI exceeding 70, the level that indicates a stock or index is overbought. That was the most since 1991.
“We felt like a pullback was inevitable because the fundamentals aren’t supporting the levels of return we have seen so far,” said Tracie McMillion, head of global asset allocation strategy for Wells Fargo (NYSE:WFC) Investment Institute. “It was largely driven by momentum and not driven by the fundamentals.”
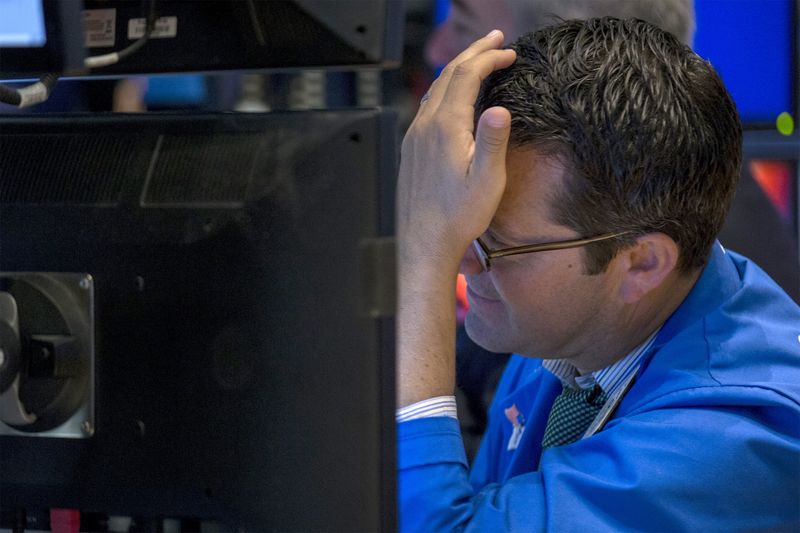
The S&P 500 fell 3.7% on Thursday as of 11:50 a.m. in New York, bringing its losses over three days to almost 5%. Pockets of the market hit hardest in the original coronavirus crash, including small-caps and cyclical industries, again bore the brunt of the losses.
To Brent Schutte, chief investment strategist at Northwestern (NYSE:NWE) Mutual Wealth Management, the stock market fell too much on the way down, yet also bounced too quickly on the way up. Somewhere between the two is probably better representative of where we stand, as economies slowly and partially reopen.
It “feels like a more accurate depiction of where we’re at right now,” Schutte said. “Future gains are going to be more dependent on how the reopening actually goes.”
(Updates prices in 12th paragraph. An earlier version of this story corrected the description of a technical indicator in the 10th paragraph.)
©2020 Bloomberg L.P.

