This post was originally published on this site
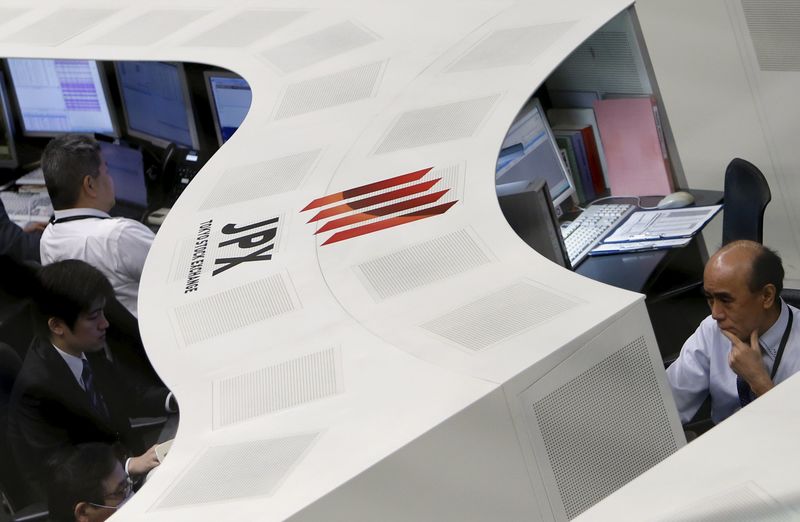
https://i-invdn-com.akamaized.net/news/LYNXNPEC0K0BS_M.jpg © Reuters. Japan stocks lower at close of trade; Nikkei 225 down 0.39%
Investing.com – Japan stocks were lower after the close on Friday, as losses in the , and sectors led shares lower.
At the close in Tokyo, the lost 0.39%.
The best performers of the session on the were SUMCO Corp. (T:), which rose 5.24% or 98.0 points to trade at 1967.0 at the close. Meanwhile, Yahoo Japan Corp. (T:) added 4.49% or 19.0 points to end at 442.0 and Rakuten Inc (T:) was up 4.11% or 39.0 points to 987.0 in late trade.
The worst performers of the session were Chiyoda Corp. (T:), which fell 6.00% or 24.0 points to trade at 376.0 at the close. Oji Holdings Corp. (T:) declined 5.03% or 30.0 points to end at 567.0 and Tokyo Dome Corp. (T:) was down 4.03% or 39.0 points to 928.0.
Falling stocks outnumbered advancing ones on the Tokyo Stock Exchange by 1900 to 1608 and 268 ended unchanged.
Shares in SUMCO Corp. (T:) rose to 52-week highs; gaining 5.24% or 98.0 to 1967.0. Shares in Tokyo Dome Corp. (T:) fell to 52-week lows; losing 4.03% or 39.0 to 928.0.
The , which measures the implied volatility of Nikkei 225 options, was unchanged 0.00% to 16.99.
Crude oil for April delivery was down 0.91% or 0.49 to $53.39 a barrel. Elsewhere in commodities trading, Brent oil for delivery in April fell 1.03% or 0.61 to hit $58.70 a barrel, while the April Gold Futures contract rose 1.01% or 16.30 to trade at $1636.80 a troy ounce.
USD/JPY was down 0.24% to 111.84, while EUR/JPY fell 0.11% to 120.75.
The US Dollar Index Futures was down 0.07% at 99.703.
Fusion Media or anyone involved with Fusion Media will not accept any liability for loss or damage as a result of reliance on the information including data, quotes, charts and buy/sell signals contained within this website. Please be fully informed regarding the risks and costs associated with trading the financial markets, it is one of the riskiest investment forms possible.

